
Next Lesson - Patient Safety and Quality Control
Core
Evidence based practice involves the integration of individual clinical expertise (from the healthcare worker in question) with the best available external evidence from systematic research. Evidence based practice attempts to reduce the number of healthcare workers continuing to use ineffective practices or failing to take on practices that have been proved to be effective.
There are two main types of evidence:
- Systematic Review - an overview of primary studies done using explicit and reproducible methods ( method is clear and reproducible)
- Meta-analysis - a quantitative synthesis of the results of two or more primary studies that addressed the same hypothesis in the same way.
This means that a meta-analysis looks at studies that are similar enough to be combined quantitatively, while a systematic review can include a broader range of studies, even those with greater clinical heterogeneity.
Problems getting evidence into practice
- Evidence exists but healthcare professionals don’t know how to access it or choose not to use it.
- Organisational systems or resources are not available to implement the change in advice following new evidence.
- Patients might not want the recommended treatment.
- NICE guidelines offering one treatment as a first choice can lead to reluctance to fund other things.
Systematic reviews are a type of literature review that collects together and analyses multiple studies around the same topic. They attempt to provide a complete summary of the current research. Systematic reviews may use meta-analyses as part of their reasoning.
They exist to: avoid or reduce bias, highlight gaps in research, address clinical uncertainty (if studies on the same topic come to different conclusions), and to assess the quality of studies and their results.
They are useful to clinicians because: they have less bias than individual studies, reduce the delay between research and implementation (because all the research is collated), save clinicians from having to investigate the research themselves, and to increase quality control and certainty.
However, it is important to note that not all systematic reviews are of equal quality. Therefore a poorly conducted systematic review can be just as harmful as a poorly conducted study. Furthermore, if a systematic review uses poor quality studies to create its conclusions then those conclusions will themselves be of poor quality. The phrase ‘ rubbish in, rubbish out’ sums this issue up.
Criticisms of Systematic Reviews
- It can be difficult to maintain a constant state of all studies being collated into a systematic review.
- Doctors have reduced autonomy because they have to follow the systematic reviews.
Meta-analyses are a collation of similar studies that have been collected to form one conclusion. They facilitate the collection of a large amount of study data and reduce problems of small sample size. They also allow the researchers to quantify the size of an effect and the confidence intervals surrounding this value as a pooled estimate. In practice, doing a meta-analysis means that the researchers look at all the data on one topic, work out the average result, calculate the degree of uncertainty around this (confidence interval), and then can release it to the public.
Meta-analysis also has formal protocols specifying many things before they start:
- The complete set of studies to be included (important to reduce bias if more information is released later)
- Identification of the common variable between the studies
- Analysis types looking for sources of variation (like checking if one study only included men)
Forest plots are the diagrammatic form of a meta-analysis.
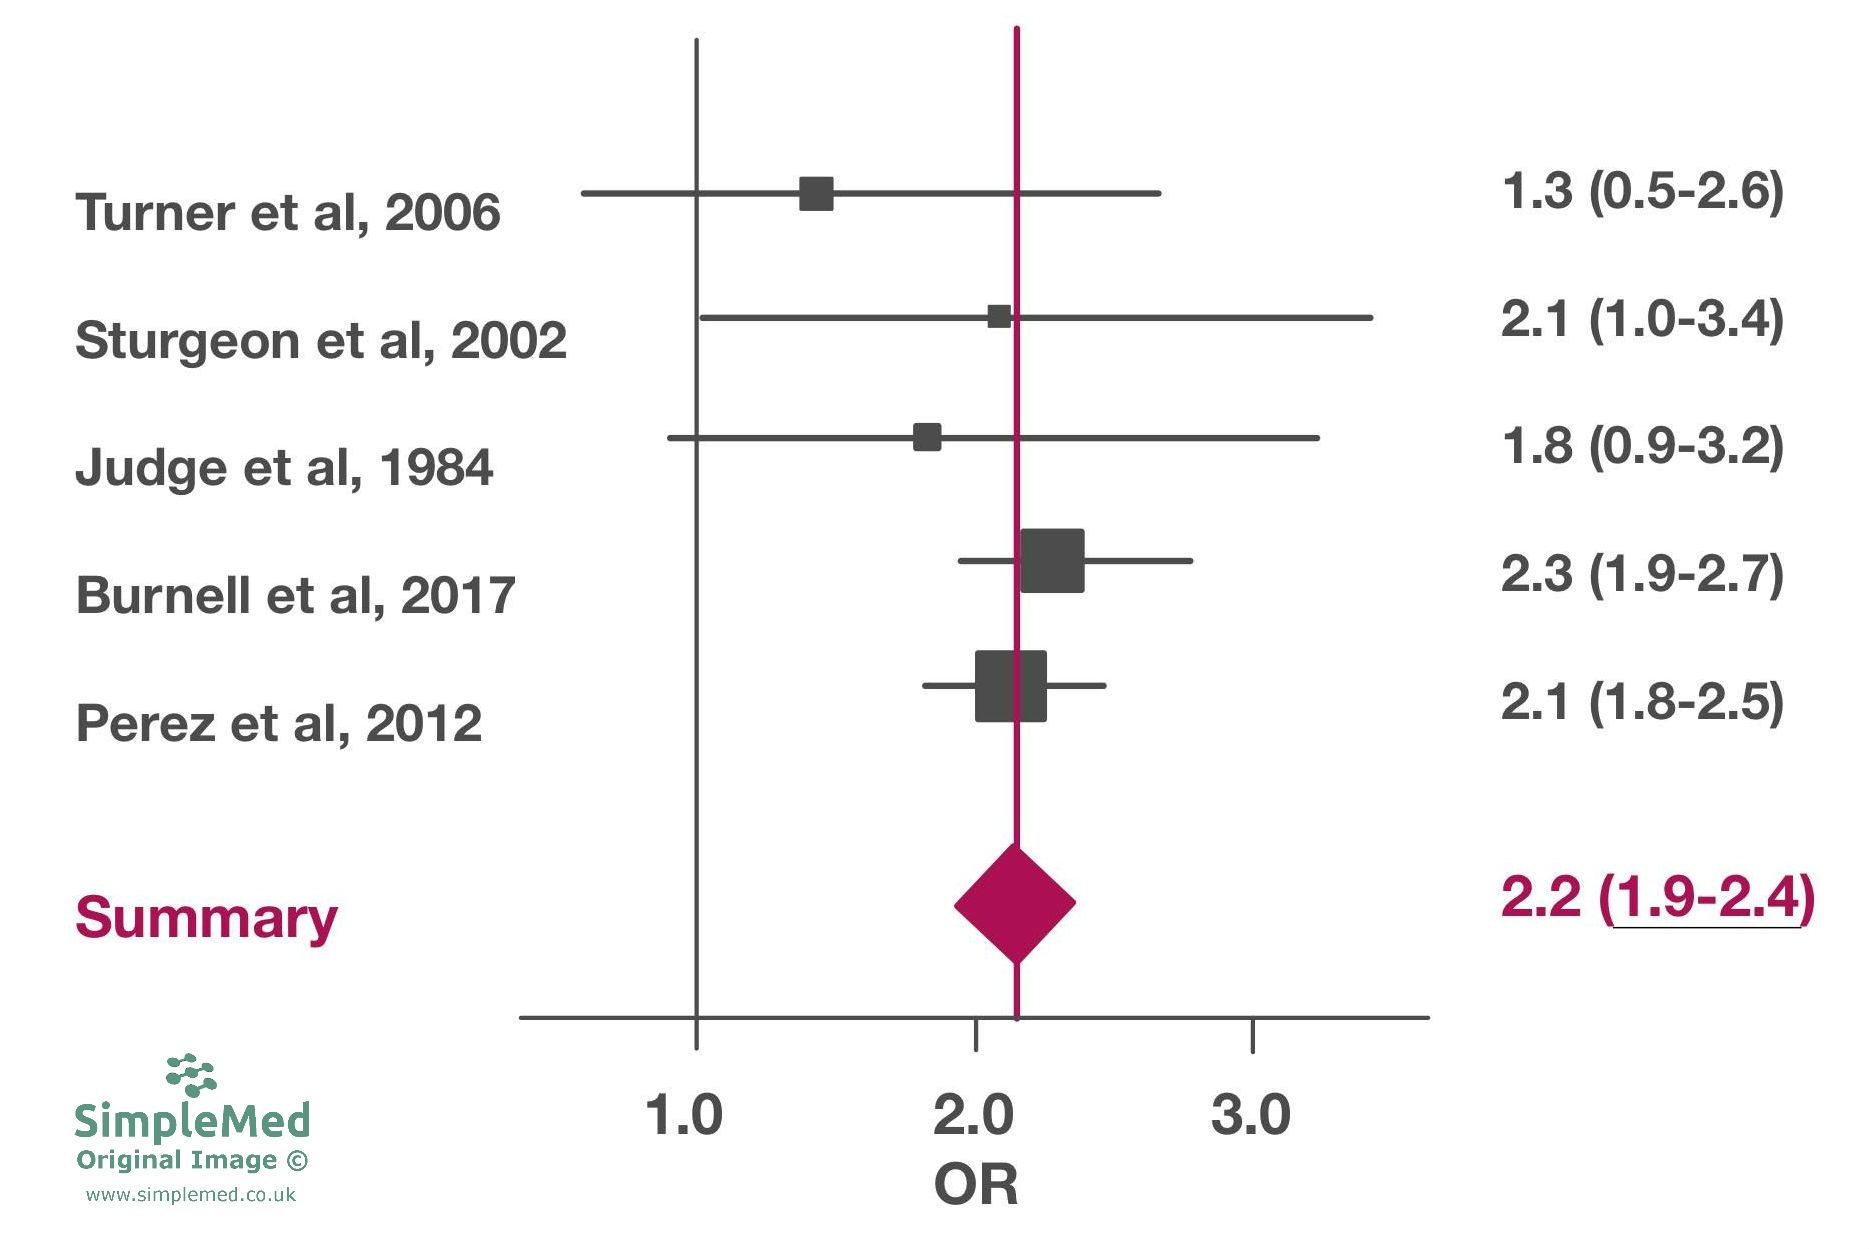
Diagram of a Forest Plot. All values and studies are fictional.
SimpleMed Original by Dr. Maddie Swannack
- A study’s individual odds ratio is indicated by a square. The size of the square is representative of how much weight is given to that study. In general the amount of weight given to a study is determined by the confidence interval of the study and the sample size (smaller confidence interval/ larger sample size = more weight = bigger square).
- A study’s confidence interval is represented by the horizontal lines out the side of each box.
- The vertical no-effect reference line is at an odds ratio of 1, which means the odds are equal in the two groups.
- The x-axis shows the effect size, here an odds ratio. For continuous outcomes, a mean difference may be used instead; the no-effect reference line is then at 0, meaning there is no difference between the group means.
- The diamond represents the pooled estimate of the odds ratio of the studies. The centre of the diamond (represented by the dotted line) represents the pooled odds ratio. The width of the diamond represents the pooled confidence interval.
- Heterogeneity between studies (studies too different)
- Fixed-effect model vs random effect model comes into play
- Sub-group analysis needs to be carried out to analyse variation
- Variable quality of studies - not all are carried out to the same standard, particularly variable between countries and based on budget-size
- Publication bias in selection of the studies - funding/moral issues that could lead to some studies remaining unpublished if they do not show the correlation they were designed to show
Variation is assessed through two methods: the fixed effect model and the random effects model.
Fixed effect model - assumes that all the studies are estimating exactly the same true effect, so all the studies are aiming for the same ‘true effect’ value. Random error from each study result is then worked out to a fixed point. No 2 studies can be exactly the same or have the same populations so the exact same true effect is a sizeable assumption in this model.
Random effect model - assumes that the studies are estimating similar (but not the same) ‘true effect’ values. As a result the ‘true value’ is the mean of these values. This model is often used when there is substantial heterogeneity, but the choice of model depends on the review question and assumptions.
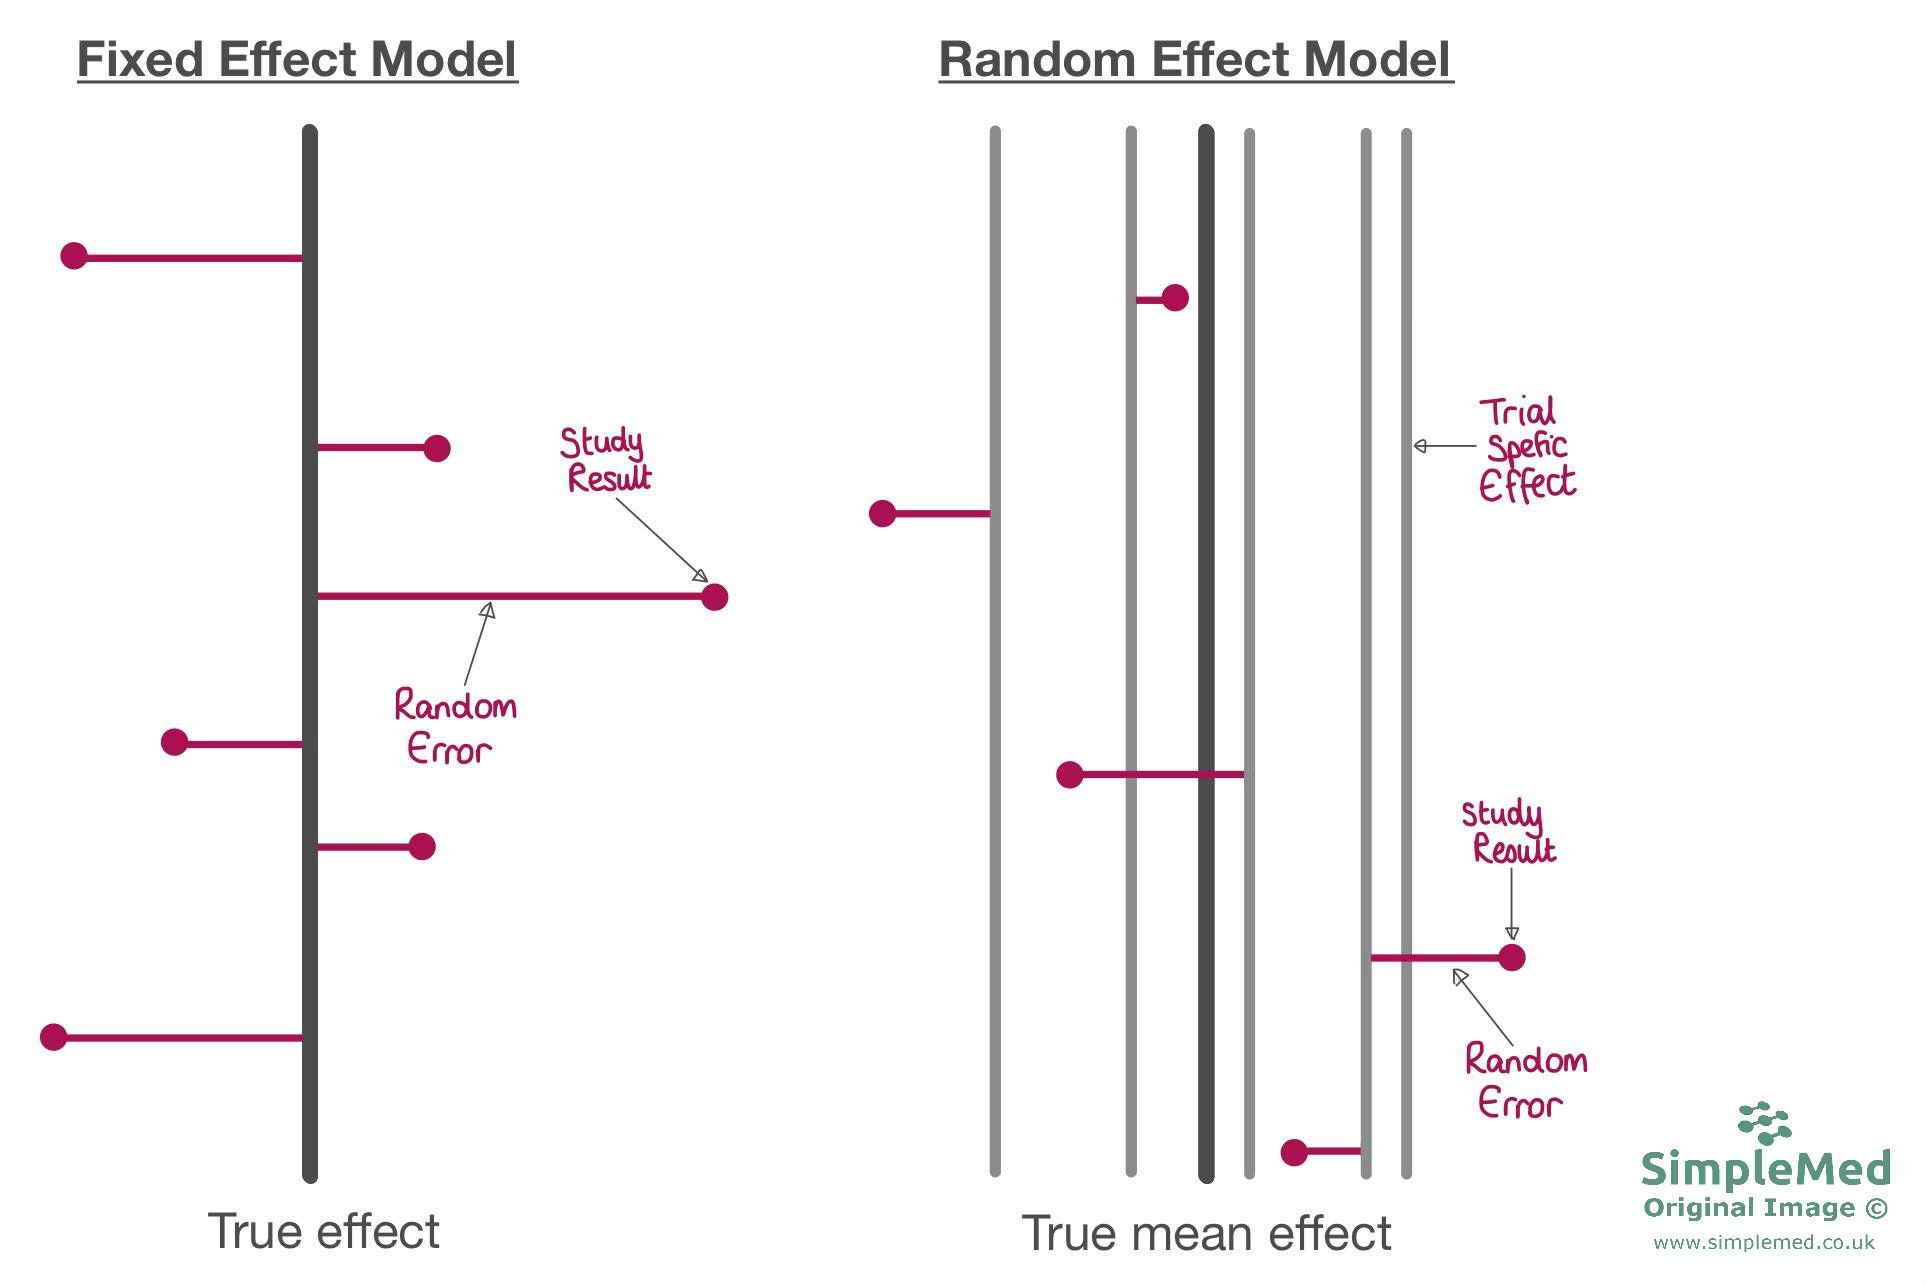
Diagram showing the differences between the fixed effect (when all studies are aiming for one true effect) and random effects (when studies are aiming for their own effect value, and the true effect is a mean of these) models.
SimpleMed Original by Dr. Maddie Swannack
These different models can produce different values for things:
- The final estimate for odds ratio is often similar with both methods.
- The confidence interval is often wider with the random effects model.
- The weighting of studies is more equal in the random effects model (more weight is given to smaller studies).
Random effects modelling accounts for variation but cannot explain it. Sub-group analysis (separating the group of participants into two groups to look if that characteristic has an effect) is used to help explain the heterogenicity, which can be useful in explaining the effects of a certain intervention or exposure.
There are two main types:
- Study characteristics - year of publication (is a later study different), length of follow up (different conclusion if follow up is twice as long), % female participants (different conclusion if all female).
- Participant profile - all data is analysed separately by type of participant eg male vs female, adult vs child, white vs non-white. Such analyses should be interpreted cautiously as they are prone to confounding and false positive findings.
Issues with Studies of Variable Study Quality
Variable quality can be due to:
- Poor study design (this is easy to assess when looking at study’s results)
- Poorly designed protocols
- Poor protocol implementation (this is hard to assess after the study is done).
Risk of bias depends on the study design, how the study was conducted and how the result was measured; no design is always the least or most biased:
- Randomisation helps control confounding, but trials can still be affected by problems with allocation, missing data or outcome measurement.
- Non-randomised trials and cohort studies require careful assessment of confounding, participant selection and measurement.
- Case-control studies using recalled exposure can be affected by recall bias: cases and controls may remember or report past exposure differently after their disease status is known. Control selection and confounding also need assessment.
Study selection and assessment of bias should be planned before the review begins:
- Define which study designs can answer the review question and specify the criteria for including studies. Cochrane reviews may include non-randomised studies when these are appropriate for the question.
- Assess the risk of bias, meaning whether a study's design or conduct could systematically distort its results, and then:
- Consider specific sources of bias when interpreting the pooled estimate. Cochrane does not recommend turning these judgements into a single numerical quality score to adjust each study's statistical weight.
- Use sensitivity analysis to check whether the conclusions change when studies at high risk of bias are excluded.
Use a domain-based risk-of-bias tool appropriate to the study design, assessing the mechanisms that could distort each result rather than assigning a single quality score. Synthesise randomised and non-randomised intervention studies separately; combine other studies only when their questions and methods are sufficiently comparable. Sensitivity analyses can test whether conclusions depend on studies at high risk of bias. A study can remain in the review even when it is omitted from a particular synthesis or sensitivity analysis.
There are many things to look at when assessing the quality of randomised control trials:
- Allocation methods (eg randomisation)
- Blinding and outcome assessment
- Patient drop out (ideally under 10%)
- Intention to treat analysis (see next article)
More than one assessor should be used when looking at the quality of studies, and they should be blinded to the results of the study, but this can be difficult as the assessors often have seen the study results before they begin.
Studies with statistically significant results or ‘favourable’ results are more likely to be published than those without, and this occurs especially with smaller studies. This means that any systematic review or meta-analysis can be flawed by this bias as some data is simply not available.
Reviewers should search for unpublished as well as published studies to reduce the risk of missing evidence. A funnel plot can help explore whether results differ between smaller and larger studies, but it does not remove publication bias. If studies are estimating the same underlying effect without important bias, smaller studies tend to show a wider spread of effect estimates because their results are less precise. Larger studies cluster more closely around the underlying effect, giving the plot its funnel shape.

Diagram showing two funnel plots, the left side being more symmetrical and the right showing asymmetry. If a funnel plot is broadly symmetrical, this suggests there is no clear evidence of publication bias or other small-study effects, but it does not exclude them. If a funnel plot shows gaps or asymmetry (as shown by the blue circle), this may indicate publication bias, particularly where smaller studies with unfavourable results are missing, although other explanations such as heterogeneity or chance should also be considered.
SimpleMed Original by Dr. Maddie Swannack
Edited by: Dr. Ben Appleby
Reviewed by: Dr. Marcus Judge
- 6708