
Next Lesson - Health Economics
Core
Chronic illnesses can be disabling in some way, but they do not always cause the patient to become disabled. In UK law (the Equality Act 2010), a person is disabled if they have a physical or mental impairment that has a substantial and long-term negative effect on their ability to carry out normal day-to-day activities. Disability is a complex and personal topic to many and this article only attempts to explore some of the established models on the subject.
Models of disability
There are 2 key models of disability:
- Medical model: Disability is caused by deviation from the medical norm and as a result interventions should aim to return the patient as close as possible to the medical norm. The limitations and disadvantages of disability stem from the existence of an impairment. Therefore the aim of treatment is to fix the impairment itself.
- Social model: There is an intrinsic failure of society to adjust to those with differing needs. This lack of consideration and adjustment leads to the creation of disability. Disability is therefore a form of social oppression and social change is required to prevent disability occurring.
The social model acknowledges the role of disabling environments; an individual is only seen as being disabled as a result of the demands of the environment. For example, dyslexia (a specific difficulty with reading, writing and spelling) is only seen as a learning difficulty in a society that values the ability to read, write or spell.
There are pros and cons of both models and the best approach likely lies somewhere between the two.
The WHO has published a number of classifications on disability. Their initial classification was the ICIDH (international classification of impairments, disabilities and handicaps). This classification defined:
- Impairment - the physical abnormality in structure, or an abnormality in function of the body.
- Disability - difficulty performing certain tasks due to an impairment.
- Handicap - the broader social and psychological consequences of living with an impairment or disability.
The ICIDH has been superseded by the ICF (international classification of functioning, disability and health). This is because the ICIDH implied a fixed progression from each term to the next, that is, impairment would always lead to disability, which would always lead to handicap. The ICIDH’s use of the term handicap is also seen by some as problematic and outdated.
The ICF describes functioning and disability using 3 components:
- Body functions and structures (a problem here is called an impairment).
- Activities (a problem here is called an activity limitation).
- Participation in life situations (a problem here is called a participation restriction).
Each of the 3 components is roughly analogous to one of the ICIDH terms (impairment, disability and handicap). Because a person’s functioning and disability happen in a context, the ICF also includes a list of environmental factors. It therefore describes the individual as well as their environment, rather than boxing individuals into problematic classifications.
Lay beliefs of health stem from what health means to the average person who has no medical training (the ‘lay person’ or ‘person on the street’). Lay beliefs can be socially embedded and can influence behaviour regarding health. This influence can be harmful because lay beliefs can often differ from medical knowledge. Patients may then be less willing to accept medical advice. This can affect concordance (the agreement reached between patient and clinician about treatment) and adherence (how closely the patient’s actions match that agreed treatment plan).
Lay beliefs develop naturally as a community seeks to understand health conditions. Medical concepts can sometimes be difficult to understand, so lay beliefs can end up as a simplified, and possibly distorted, version of medical knowledge.
There are three important behaviours that patients may partake in:
- Health behaviour - activity undertaken to maintain health and prevent illness. This could include eating healthily and taking regular exercise.
- Illness behaviour - activity undertaken by a patient who feels ill to define the problem and seek treatment. This could include seeing a doctor to get a diagnosis and negotiating an agreed treatment plan.
- Sick role behaviour - activity performed by a patient who is ill to actively make themselves better. This includes taking medications prescribed.
Illness behaviour can be affected by many factors because it involves the patient admitting there is a problem and seeking help, which can be difficult for some patients. It therefore depends on the following things:
- Culture - in some cultures, seeking help from an external source is seen as a bad thing. For example, men may be encouraged to "man up" instead of seeking counselling for mental health problems.
- Visibility of symptoms - it can be easier to delay illness behaviour if the symptoms are easy to hide.
- Extent of disruption - illness behaviour often occurs more quickly if the illness interferes with daily life or work.
- Information available - if the patient is worried that they might have cancer (even if cancer is unlikely), they might delay illness behaviour, such as seeing a doctor, because they don’t want to receive bad news.
- Lay referral - this is when someone close to the patient recommends certain services to them. It is important because it often explains delays in seeking professional help, and why some patients present ‘now’. For example, a patient may say ‘my partner told me to come in to get seen’. The patient has first talked to their partner (another lay person), who has ‘referred’ them to the doctor.
There are three main categories that patients may fall into with regard to adherence to treatment:
- Deniers - individuals who don’t believe they have the disease, so don’t follow the treatment plan as that would mean accepting the condition. A related group is distancers: patients who play down their condition and symptoms as not serious and not needing treatment.
- Accepters - these people accept that they have the condition and view it as vital that they adhere to the treatment plan, so they can lead a normal life.
- Pragmatists - individuals who only seek help on deterioration, when the condition becomes practically bothersome.
Health promotion is the process of enabling people to increase control over and improve their own health. There are five main approaches to health promotion:
- Medical interventions to protect from risk - e.g. statins (cholesterol-lowering drugs) to reduce cardiovascular disease risk, gastric band surgery (an operation that limits how much food the stomach can hold) to reduce obesity.
- Behaviour change - e.g. campaigns on TV encourage positive behaviour changes, like the Change4Life program run in the UK.
- Educational - campaigns run in education, e.g. healthy eating classes in primary schools.
- Empowerment - making the public aware and able to access the services that they need to help improve their health.
- Social change - often through regulations, e.g. the sugar tax on sugary soft drinks (the Soft Drinks Industry Levy), the public smoking ban in the UK.
PROMs
A patient reported outcome measure (or PROM) is a tool, usually a short questionnaire that patients complete themselves, that measures their health status or health-related quality of life from their own perspective. PROMs are often completed before and after a treatment to measure its outcome. A patient reported outcome (PRO) is the patient’s own report of their health, quality of life or function; the PROM is the tool used to record it. PROMs are different from patient reported experience measures (PREMs), such as satisfaction scales, which capture the patient’s experience of their care.
PROMs can be generic (for any patient population) or disease specific (for a particular condition); unidimensional (measuring one aspect of health, such as pain) or multidimensional (measuring several aspects, such as overall health-related quality of life).
PROMs are important because they:
- Assess symptom burden (how much symptoms affect the patient) and psychological impact, which are often under-recognised in patient populations.
- Place more emphasis on quality of life rather than simply length of life.
- Help to improve and guide shared decision making between patient and clinician.
- Provide the patient’s perspective, which the clinician may otherwise have missed.
Clinical trials often use PROMs as part of their structure. This is because PROMs provide quantifiable data that is clinically meaningful, so they can help to monitor how a condition progresses and how well a treatment works. They can also be used to monitor adherence and assess adverse effects. Their quality-of-life scores can be combined with survival data to calculate quality-adjusted life years (QALYs: years of life weighted by their quality of life; see our article on health economics).
When evaluating PROMs to use, certain characteristics must be considered:
- Appropriateness - are the questions asked going to get the desired information?
- Acceptability - will patients be able to fill in the PROM, understand the questions and be willing to complete it?
- Feasibility - is it easy to administer and process?
- Interpretability - are the results easy to interpret and do they produce meaningful information?
- Reliability - are the results reproducible?
- Validity - does it measure what it claims to?
- Responsiveness - does it detect changes that matter to patients?
There are three levels of prevention (primary, secondary and tertiary) that can be put in place to help prevent harm to health:
These interventions prevent the onset of disease by reducing exposure to risk factors. This can be done by four main methods:
- Immunisations - for example, routine childhood vaccinations.
- Prevention of contact with environmental risk factors - for example, using insect repellent to protect against mosquito bites.
- Taking precautions against communicable diseases (infections that spread from person to person) - for example, wearing condoms to protect against sexually transmitted infections.
- Reducing risky health behaviours - for example, helping people stop smoking.
These interventions aim to detect and treat a disease (or the risk factors) at an early stage to prevent future complications. Examples include screening programmes for cervical cancer, and monitoring and treating hypertension.
These interventions aim to minimise the effects of established disease. Examples include: giving steroids to treat asthma and giving renal transplants in renal failure.
A screening programme is a form of secondary prevention that acts to detect early stages of a disease in order to treat it before it causes symptoms or harm. In the UK, the UK National Screening Committee (UK NSC) makes recommendations on screening to ministers in all 4 UK countries. A proposed national screening programme is judged against the UK NSC criteria, which draw on the Wilson-Jungner criteria (principles of screening published by the World Health Organization in 1968). The main criteria are:
- The condition must be an important health problem, judged by how common it is (frequency) and/or how serious it is (severity) - this article will use the example of the cervical cancer screening programme.
- All cost-effective primary prevention should already have been put in place as far as practicable - for example, human papillomavirus (HPV) vaccination.
- There must be a simple, safe, precise and validated screening test. In cervical screening (which used to be called a smear test), a small sample of cells is taken from the cervix (the opening of the womb from the vagina). The sample is first checked for the types of HPV that can cause cell changes (high-risk HPV), and is only checked for abnormal cells if these are found.
- There must be an agreed target population - in England, women and people with a cervix aged 25 to 64 are invited every 5 years, or sooner if HPV is found. Scotland and Wales also invite people aged 25 to 64 every 5 years. Northern Ireland still invites people aged 25 to 49 every 3 years and those aged 50 to 64 every 5 years.
- There must be evidence that intervention at the pre-symptomatic stage (before symptoms start) is beneficial. In cervical screening, pre-cancerous cells (called cervical intraepithelial neoplasia, or CIN) can be detected and treated to help prevent cervical cancer.
- The opportunity cost must be acceptable (value for money). Opportunity cost is the health benefit that is lost because the money is not spent on the next best alternative, such as another health service it could have paid for instead.
- The screening programme must be possible to implement - for example, the cervical screening sample is usually taken by a trained nurse or doctor.
There are a number of types of screening programmes:
- Mass screening screens every individual for diseases. An example of this is the newborn blood spot tests, that screen every baby for genetic conditions such as cystic fibrosis.
- Selective screening involves offering the screening test only to groups at higher risk of the condition. The UK National Screening Committee calls this targeted screening. The higher risk comes from something other than age or sex, such as lifestyle, genetic variants (differences in genes) or another health condition. For example, people who smoke have a higher risk of lung cancer, whatever their age or sex. A programme offered to a group defined by age or sex is population screening, not targeted screening. An example of this is the cervical screening programme, which is offered only to women and people with a cervix in a set age range (see the target population above).
- Opportunistic screening is a screening programme implemented only when the opportunity arises. An example of this is a GP checking the blood pressure of anyone over 60 years old who presents to them in general practice; no one is called in for this, it is done because they are already there.
Screening tests are indicative of the risk a person has of having the disease. They are not diagnostic.
True Positive - individuals with a disease who receive a positive screening test result. The result indicates that they have a high chance of having the disease, so they are referred for further testing. This is good because it means that the people with the disease are caught early, diagnosed and treated.
True Negative - healthy individuals who receive a negative screening test result. The screening test indicates that they have a low chance of having the disease, which is correct because they are healthy. They avoid further testing or treatment, which may itself be harmful.
However, it is possible to get results out of the screening test that are incorrect.
False Positive - healthy people getting a positive screening test result. This means the test indicated they have a high chance of having the disease, but they don’t in reality and are referred for further testing. As a result, they have expensive and possibly harmful further tests, which show that they are healthy.
False Negative - diseased people getting a negative screening test result. This means the test indicated they have a low chance of having the disease, but they really do have it, and are not referred for further testing. As a result, the disease is not diagnosed at an early stage and can progress without treatment. This delays diagnosis and may harm the patient, because the disease is more advanced by the time it is found.
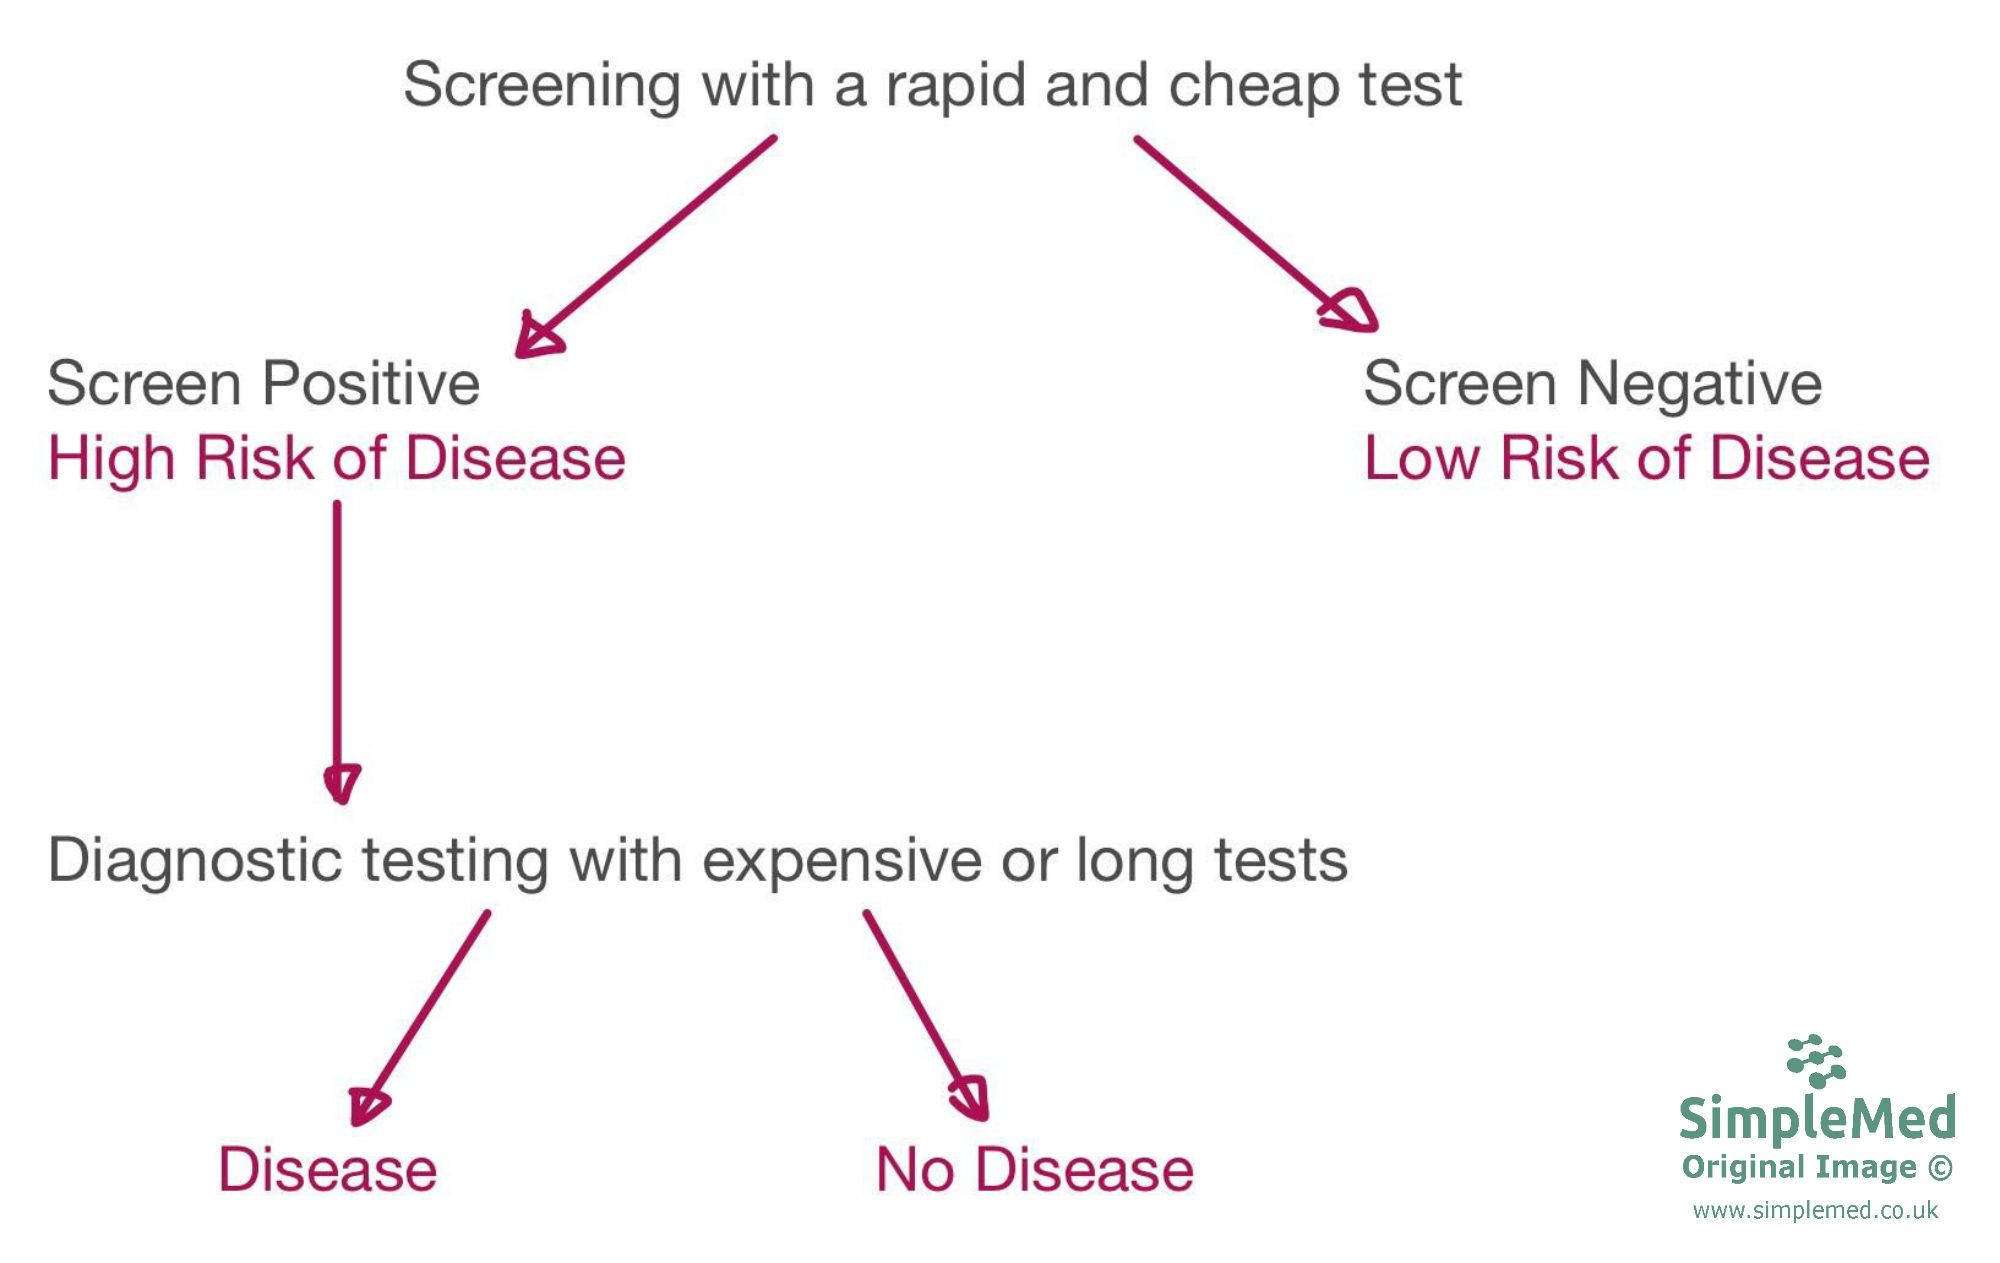
Diagram - The process a patient will go through if they have a screening test performed in secondary prevention. A screening test shows the likelihood of the person having the disease, and is not a complete diagnostic test. It is still important to remember that patients who screen negative could still have the disease. They are just not investigated any further.
SimpleMed original by Dr. Maddie Swannack

Table - The relationship between the screening result and the true state of the patient
SimpleMed original by Dr. Maddie Swannack
Key Terms
There are several key terms regarding screening tests that relate to the values shown in the table above. In the formulas below, a = true positives, b = false positives, c = false negatives and d = true negatives.
Sensitivity - proportion of people with the disease who test positive (true positives as a proportion of everyone with the disease).
- High sensitivity = good at picking up the disease.
- Sensitivity = a / (a+c)
- This is the number of true positives divided by total number of patients with the disease.
Specificity - proportion of people without the disease who test negative (true negatives as a proportion of everyone without the disease).
- High specificity = good at correctly giving healthy people a negative result, so there are few false positives.
- Specificity = d / (b+d)
- This is the number of true negatives divided by total number of healthy patients.
Sensitivity and specificity are mainly features of the test rather than of the population, so they are generally considered stable when the same test is used in a different population. They are not completely fixed, however: they can vary between populations, for example when the mix of patients (such as mild and severe cases) differs.
Positive Predictive Value (PPV) - probability that someone who tested positive actually has the disease.
- Higher positive predictive value = more accurate at indicating disease state.
- PPV = a / (a+b)
- This is true positives divided by number of people who tested positive.
Negative Predictive Value (NPV) - probability that someone who tested negative is actually healthy.
- Higher negative predictive value = more accurate at indicating healthy state
- NPV = d / (c+d)
- This is the true negatives divided by the number of people who tested negative.
Unlike sensitivity and specificity, the PPV and NPV change with how common the disease is in the population being tested (its prevalence). So predictive values found in one population should not be applied to another population where the disease is more or less common.
Sensitivity and specificity describe a test at a chosen threshold (cut-off), but on their own they do not show how much one person’s result changes their chance of having the disease. Our section on likelihood ratios and ROC curves covers this (ROC stands for receiver operating characteristic). It shows how to get from the pre-test probability (the chance of disease before the test) to the post-test probability (the chance after the result is known), and how moving the threshold trades sensitivity against specificity.
Evaluating Screening Programmes
Screening programmes can be difficult to evaluate because of several built-in biases (systematic errors that distort the results).
Lead time bias
The early diagnosis caused by screening programmes can falsely appear to prolong the survival.
For example, a patient develops a disease that will kill them 10 years after it starts, whatever treatment they have. Without screening, the patient presents 8 years after the disease starts, when it is in its late stages and causing symptoms. Their survival after diagnosis is therefore 2 years.
With screening, the disease is diagnosed 5 years after it starts, because the test picks it up in its early stages, before the patient notices any symptoms. The patient still dies 10 years after the disease starts, so their survival after diagnosis is 5 years.
Screening therefore appears to add 3 years to survival, when in fact the patient dies at the same time and is simply diagnosed earlier.
Length time bias
Length time bias occurs because screening preferentially detects slower-growing cancers. These cancers spend longer in a detectable phase before symptoms develop, so there is more opportunity to find them at a scheduled screen. Screen-detected cases may therefore appear to have better survival partly because their disease progresses more slowly. This is distinct from overdiagnosis, which means detecting a cancer that would never have caused symptoms or harm during that person’s lifetime. Overdiagnosis can lead to unnecessary treatment, with avoidable physical harm, anxiety and cost.
Selection bias
People who choose to attend screening may also be more likely to do other things that protect their health. This group may therefore be less likely to get the disease in the first place, whether or not screening helps them.
Edited by: Dr. Ben Appleby
Reviewed by: Dr. Thomas Burnell and Dr. Marcus Judge
- 6480