
Next Lesson - Models of Health
Core
See our summary and glossary article which explains the terms used in this article.
There are four main types of observational studies used in the study of populations.
They are split into descriptive (where the outcome is a qualitative or wordy description of the findings) and analytical (where the outcome is a quantitative or numerical value representing the findings).
The two types of descriptive study discussed in this article are ecological and cross-sectional studies, and the two analytical studies discussed are cohort and case-control studies.
Throughout this article, disease is used as the focus in every study design, and asthma is used as every example. This is done to make the study designs easier to compare. However, these study designs could be used for a wide variety of epidemiological hypotheses, and their use is not limited to disease investigations.
A “Case” in this article refers to a study participant that has the disease. A “Control” is a study participant that does not have the disease/ has not been exposed to a factor but is included in the study for comparison.
Any numbers in this article are purely hypothetical and do not represent the true results of any known studies.
Common Flaws with Study Designs
All study designs have common flaws, relevant to all types. These are grouped together here so that they don’t have to be explained four times, as they apply to all four study designs.
Random error: It is important to remember that the most common error in all study design is random error, aka chance. It is impossible to completely remove this element, but many things can be done to help to reduce it and make its effect known, such as declaring confidence intervals in the results, increasing sample size or randomising which participants are in each of the study groups. Increasing sample size is a very useful tool to reduce random error as it dilutes the effects of chance.
Lack of general applicability/ generalisability: Lack of generalisability applies to any study where a sample of the population is chosen rather than studying the whole population. If the designer has taken 1000 people from the city of London to do their study, they cannot necessarily say that those 1000 people represent the 8.2 million other people in London. This means that their study would have low generalisability. This could be improved by increasing the sample size (number of people in the study) or sample pool (taking a group from each borough) but this is expensive.
Confounding variables: Confounding variables are external variables that influence individuals within the study that the study organisers may not necessarily know about. Confounders can affect both the dependent and independent variable. This means that the confounding variable could cause an inappropriate association between the independent and dependent variable (a false result). A relationship could be found between two variables which does not exist in isolation but is a direct result of the confounding variable. An example of this would be: the amount that a loaded bow is pulled back and how far the arrow flies. In theory, the more force that is applied, the further the arrow would fly in one direction. However, the confounding variable in this case would be the wind on that day - if the wind blows in different directions the flight of the arrow will be affected. Once identified this confounder can be controlled for e.g. trying the experiment on a windless day. Only then can a true association between distance drawn back and distance be established.
Ecological studies are the easiest study design to understand and an example of a descriptive study. They involve collecting a population of people, separating that group by a characteristic (usually geographical), and then looking at the occurrence of the disease (number of cases) in each group. As a result, they are fast to complete and cheap.
For example, the population of a town could be the target population for this study, and the characteristics that the population is being separated by could be distance from a motorway. If the disease investigated was asthma, the results of the study would be a set number, for example, “There are 4000 cases of asthma in residents less than a mile from the motorway compared to 3000 cases of asthma in residents more than a mile from the motorway.”
There are a number of flaws with the ecological study design:
- Confounding variables are common and difficult to expose.
- Lack of generalisability is common.
- Ecological fallacy - as data is gathered about the large groups or populations it can’t accurately be applied to individuals.
Cross-sectional studies are a second type of descriptive study commonly used. To perform this study, the researcher must find the number of cases at a certain time within a group of the population. This ‘snapshot’ provides good information for prevalence but does not study exposure or any causal link. This study also is less helpful when studying rare diseases as it is likely that individuals will be missed in the sample size.
For example, “In 2015, there were 250,000 people with asthma in England.”
This study is commonly carried out via door-to-door surveying and other similar methods.
This study design also has multiple new terms associated with it:
- Prevalence - the number of people with the disease in the population divided by the total number of people in the population at a given time.
There are some flaws with the cross sectional study design:
- Sampling bias - this occurs when some members of the population are more likely to be selected to participate in the study. This could happen, for example, if the study takes place during the day. This would then exclude individuals who work during the day, and would therefore skew the results of the study because these people cannot be included. This would then mean that the study would not accurately represent the population.
- Participant bias - this is when the participant acts in a certain way because they think that is how the researchers wants them to behave. For example, if a patient knows whether they have been given the drug or the placebo in a drug trial, they might exaggerate or play down their symptoms. This can be unintentional on the part of the participant.
Cross sectional studies can still be used to test hypotheses, including a null hypothesis, for example when comparing prevalence between groups. However, because exposure and outcome are measured at the same time, they cannot establish temporal sequence or causality.
Cohort studies are a common type of analytical study. They involve classifying the healthy participants based on their exposure and then investigating how many of each type go on to develop disease.
For example, if investigating the influence of mould in a home on the development of asthma, the participants would be classified into whether they had lived in a house with mould (the independent variable), and then the development of asthma would be the outcome of interest (the dependent variable). The study would then follow both classes or groups throughout their life to see if and when they develop asthma. This is useful as it can be used to demonstrate associations between exposures (mould) and conditions (asthma), and can support causal inference.
Cohort studies can come in two types:
- Prospective cohort studies take participants who have just been exposed and investigate their future development of the disease.
- Retrospective cohort studies take participants who have been exposed in the past and investigate the development of the disease in the present. This is still classified as a cohort study because the participants are put in groups based on their exposure rather then based on their disease state.
Cohort studies also use some specific language terms;
Person years - the total number of years that all individuals in the study are observed for. A person is no longer observed when they die or when they leave the study. Person years is simply a measure of time. If 100 people are observed for 2 years, that is 200 person years.
Incidence rate - The incidence rate of the exposed population is worked out by dividing the number of people who developed the disease in the exposed group by the total person years at risk. For example, if 100 exposed individuals each contribute an average of 5 years at risk, this gives 500 person years. If 10 people develop asthma, the incidence rate is 10 / 500, which is 0.02 cases per person year at risk. While incidence rates are based on person time rather than headcount, the sample size still affects the precision of the estimate.
Incidence rate ratio - this is the ratio between the incidence rate of the exposed and the incidence rate of the unexposed. This shows how much more likely it is for a participant to have developed the disease if they have been exposed.
Cohort studies also have many issues:
- Loss to follow-up - outcomes may be unavailable when participants leave a prospective cohort or when records are incomplete in a retrospective cohort. Fewer observed outcomes reduce precision. Loss can also bias the exposure–outcome comparison if the reasons for missing outcomes are related to exposure and disease risk. Record the reasons for loss and assess their relationship to both exposure and outcome. Examples include:
- Survivor bias - restricting analysis to participants who survive or remain available can select a healthier group. This may distort the exposure–outcome comparison, rather than merely make the sample less representative.
- Differential loss - the frequency or reasons for missing outcomes may differ between exposure groups. If loss is also related to the outcome, the estimated association may be biased. Even loss that does not introduce bias reduces the information available. Observation bias - this error comes from a miscalculation error. If participants are asked to provide measurement or data there can be issues with incorrect reporting of results.
Cohort studies are usually expensive as they involve large sample sizes to mitigate loss to follow up and require the resources to follow up these large groups many years into the future. However cohort studies are very helpful for producing a large amount of data and allowing for prevalence and incidence to be calculated.
The following considerations should be made when designing a successful cohort study:
The acronym PICO can be used to remember what needs to be established when designing a cohort study.
Population - who will be sampled from?
Intervention - what is the exposure of interest
Comparison - who is being compared against, who is the control group from the sample population (those who lack exposure).
Outcome - what is the end condition being determined.
In our example
P - Children who live in x city.
I - the presence of mould in the family home.
C - children who live in the city in non mouldy houses.
O - development of asthma in 20 years.
Case control studies are the final type of study discussed in this article and are an analytical type of study. They involve finding participants who suffer from the disease (cases) and those who do not (controls) and looking into their past to see if they have been exposed. This means that case control studies are always retrospective.
For example, participants with asthma and participants without asthma are included, and everyone is investigated to see if they have been exposed to mould in their houses previously.
This data can be put into a simple table, as seen below.
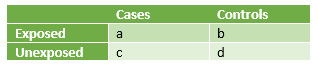 Table - Cases vs Controls in exposed and unexposed circumstances for a case control study
SimpleMed Original by Dr. Maddie Swannack
This table can then be used to work out the following:
- The odds of exposure having an effect - exposed cases divided by unexposed cases or a/c.
- The odds of exposure not having an effect - exposed controls divided by unexposed controls or b/d
- This means that the odds ratio is worked out by doing a/c divided by b/d which simplifies to ad/bc. This means that the ‘expected results’ (exposed cases x unexposed controls) are divided by the ‘unexpected results’ (unexposed cases x exposed controls).
The issues with case control studies are the following:
- Selection bias - this is the bias that occurs naturally in this study design because there can be no element of randomisation with the groups that the participants are put in.
- Random error.
Case control studies are helpful as they are cost effective and do not require any follow up. They are also more useful in studying chronic diseases compared to cohort studies as they allow selection of already ill individuals.
Case-control studies are susceptible to confounding. When exposure is recalled after diagnosis, uncertainty about its timing can make it difficult to establish whether exposure preceded disease; early disease may also have changed behaviour. This is not an inherent inability to establish sequence: reliable dated records or samples collected before disease onset can provide evidence of earlier exposure. Conventional case-control sampling does not directly provide incidence or prevalence because the selected case and control counts do not supply the population denominator.
Confidence Intervals - Case Control and Cohort Study Designs
Numerical data produced from studies can only be trusted a certain amount due to the flaws mentioned above with each study design. A nominal 95% confidence interval uses a method designed to cover the fixed population parameter in 95% of repeated samples under its assumptions; it does not assign a 95% probability to the parameter lying in one observed interval.
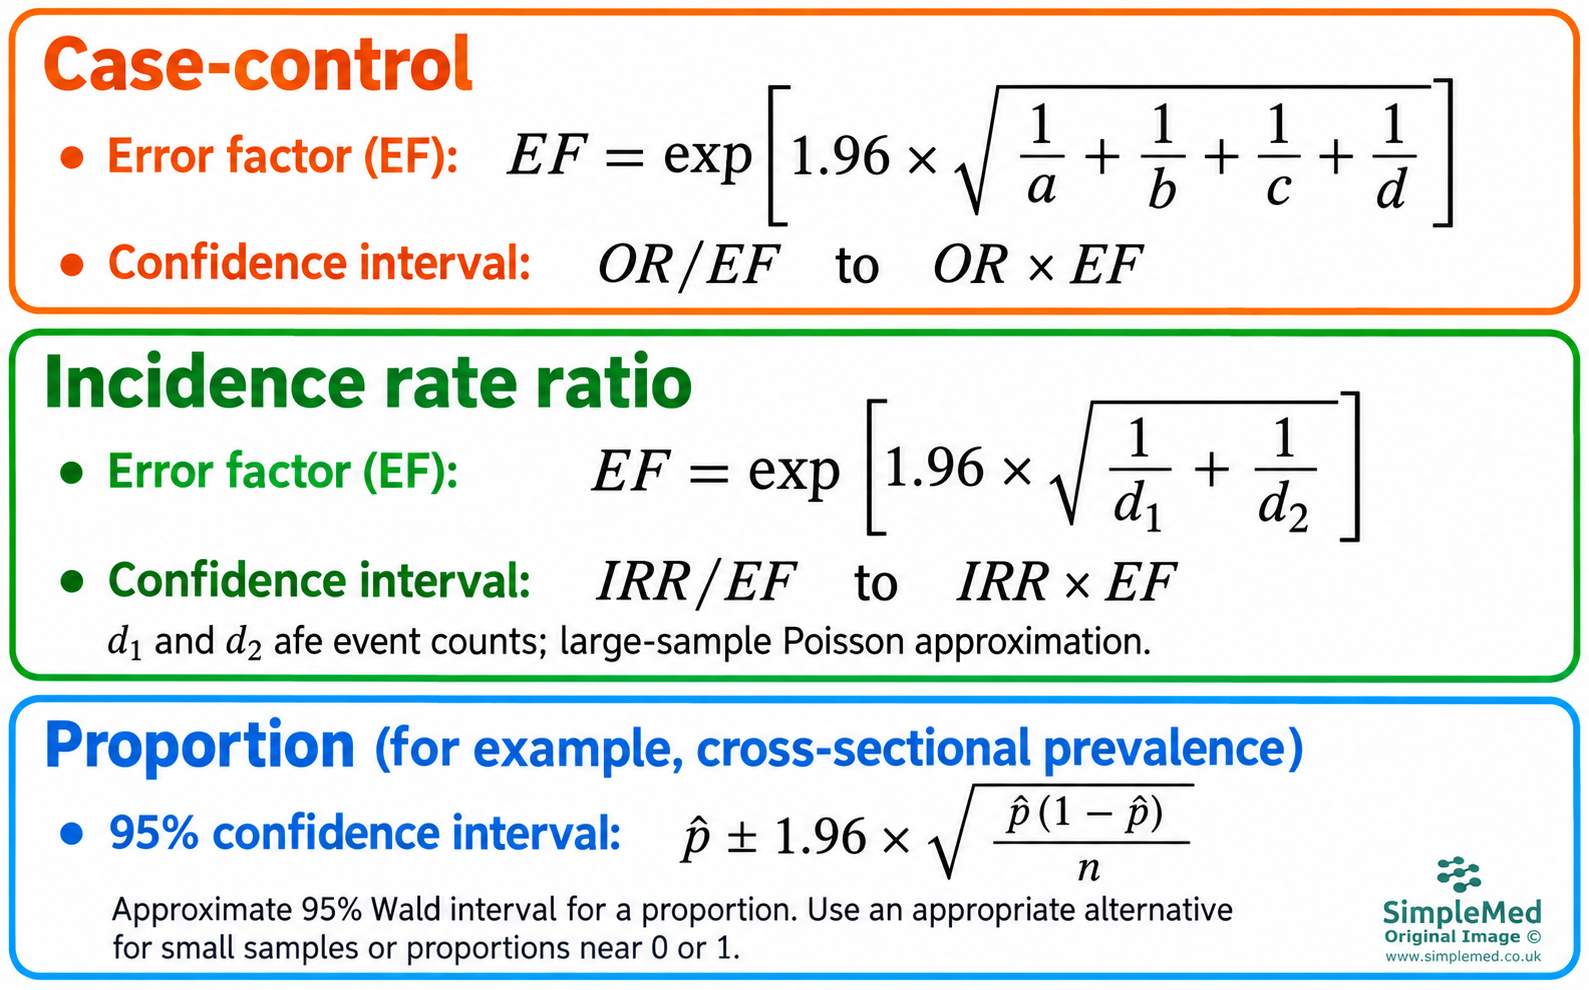
Figure — approximate normal-based 95% intervals for an odds ratio, an incidence rate ratio using event counts, and a binomial proportion. The figure uses 1.96. Both worked examples below use 2 as a rounded approximation to 1.96, so their numeric limits differ. The methods require suitable assumptions; the proportion panel warns about small samples and values near 0 or 1.
SimpleMed — corrected formula diagram (2026-10-01)
The confidence interval is worked out through a number called the error factor. This is worked out according to an equation specific to the study design, as shown here.
- In the case control study, the letters a-d in the error factor equation reflect the values in the table used in this study design.
- In the cohort study equation, d1 and d2 represent the cases in population 1 (exposed) and the cases in population 2 (unexposed).
The confidence interval (CI) is worked out using the error factor, and one piece of data from the study (notated here for clarity as the randomly chosen symbol ꝋ). To find the lower bound of the CI, ꝋ is divided by the error factor. To find the upper bound of the CI, ꝋ is multiplied by the EF. The CI is the distance between the lower and upper bound.
Working out Confidence Intervals
ꝋ is a symbol randomly assigned to represent the data chosen from the study to work out the CI. Its true value is as follows:
- The CI for a case control study uses the odds ratio (OR).
- The CI for a cohort study uses the incidence rate ratio (IRR).
Like previously mentioned, confidence intervals are the range of values around the study value where the true value could lie. There is some doubt because studies cannot guarantee to be correct 100% of the time.
Confidence Intervals - Cross Sectional Study Design
The equation used for working out the confidence intervals for cross sectional study design is different to the type used for cohort and case control studies. This is because in a cross sectional study, there is only one result (the proportion) rather than in the other designs where you might have two or more. This equation can seem a little confusing at the start, but it will be gone through step by step.
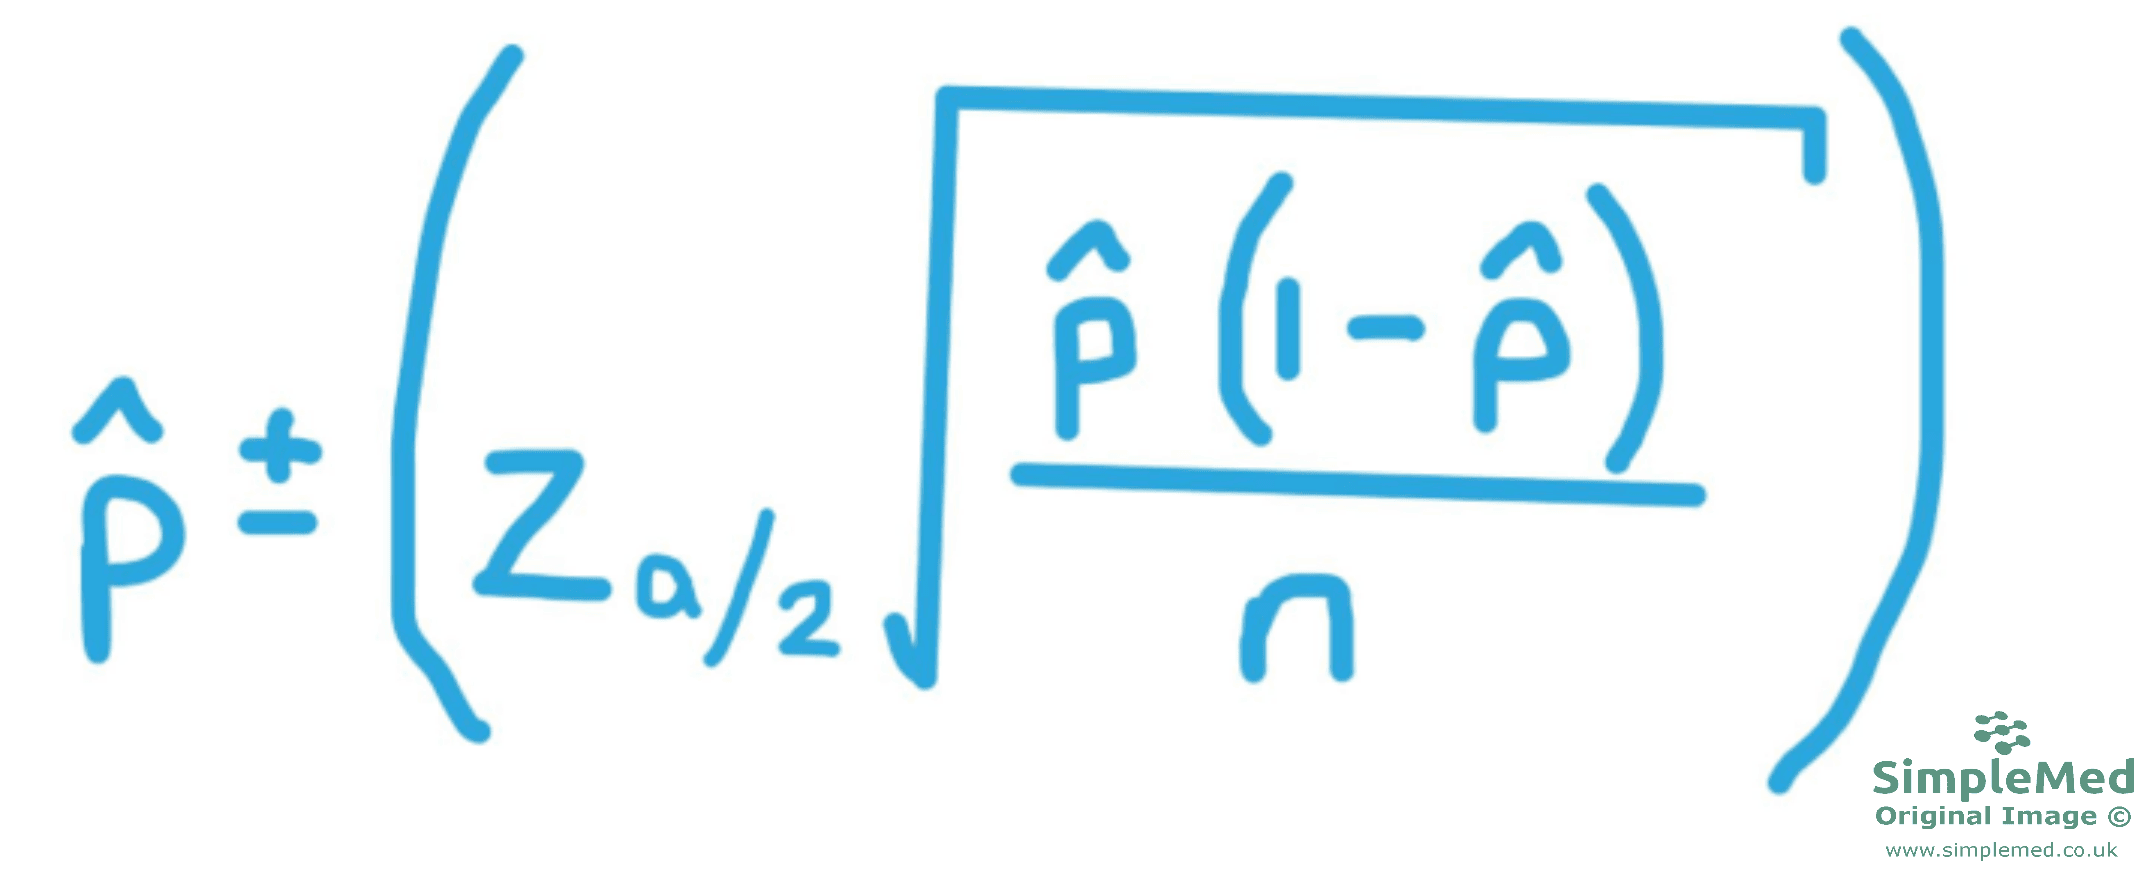
Figure - The equation used to find the confidence interval of a cross sectional study
SimpleMed original by Dr. Maddie Swannack
This is the equation used to work out the confidence intervals in cross sectional studies. An extra set of brackets (the larger ones) to help aid clarity when considering the order of operations.
In this example, the study results will be that out of 500 households observed, 337 had one or more member of that household currently under 18 (called ‘child’).
This means we need to find the proportion of households with one child in, out of the total sample size of 500 (represented by the letter n). This means we do 337 / 500, giving us a proportion of 0.674. In this equation, this represents the symbol p̂ (called ‘p hat’).
However, it is important to remember that this sample might not be representative of the whole population, so it is important to work out a confidence interval to give a more realistic representation of the whole population. To calculate a meaningful confidence interval about the whole population proportion, there are two conditions that must be met by your sample:
- The size of your sample must be no more than 5% of the size of the population it was drawn from. This might seem counterintuitive but stick with it.
- The sample must have approximately a normal distribution. This can often be met by random sampling.
This next section will be the same regardless of the study results, so long as they are using a 95% confidence interval:
Next we have to work out the 95% confidence interval. This means that there is 5% of the distribution not included in our confidence interval, called α (alpha). Using the diagram below, we can see that 95% of the distribution is in the centre, leaving 2 2.5% ‘tails’ either side of this central portion, making up the 5% of the distribution that is called α. This means that α=0.05 and α/2=0.025.Then, we use a Z table to work out the number of standard deviations from the mean that correspond to the 5% not included in our study.
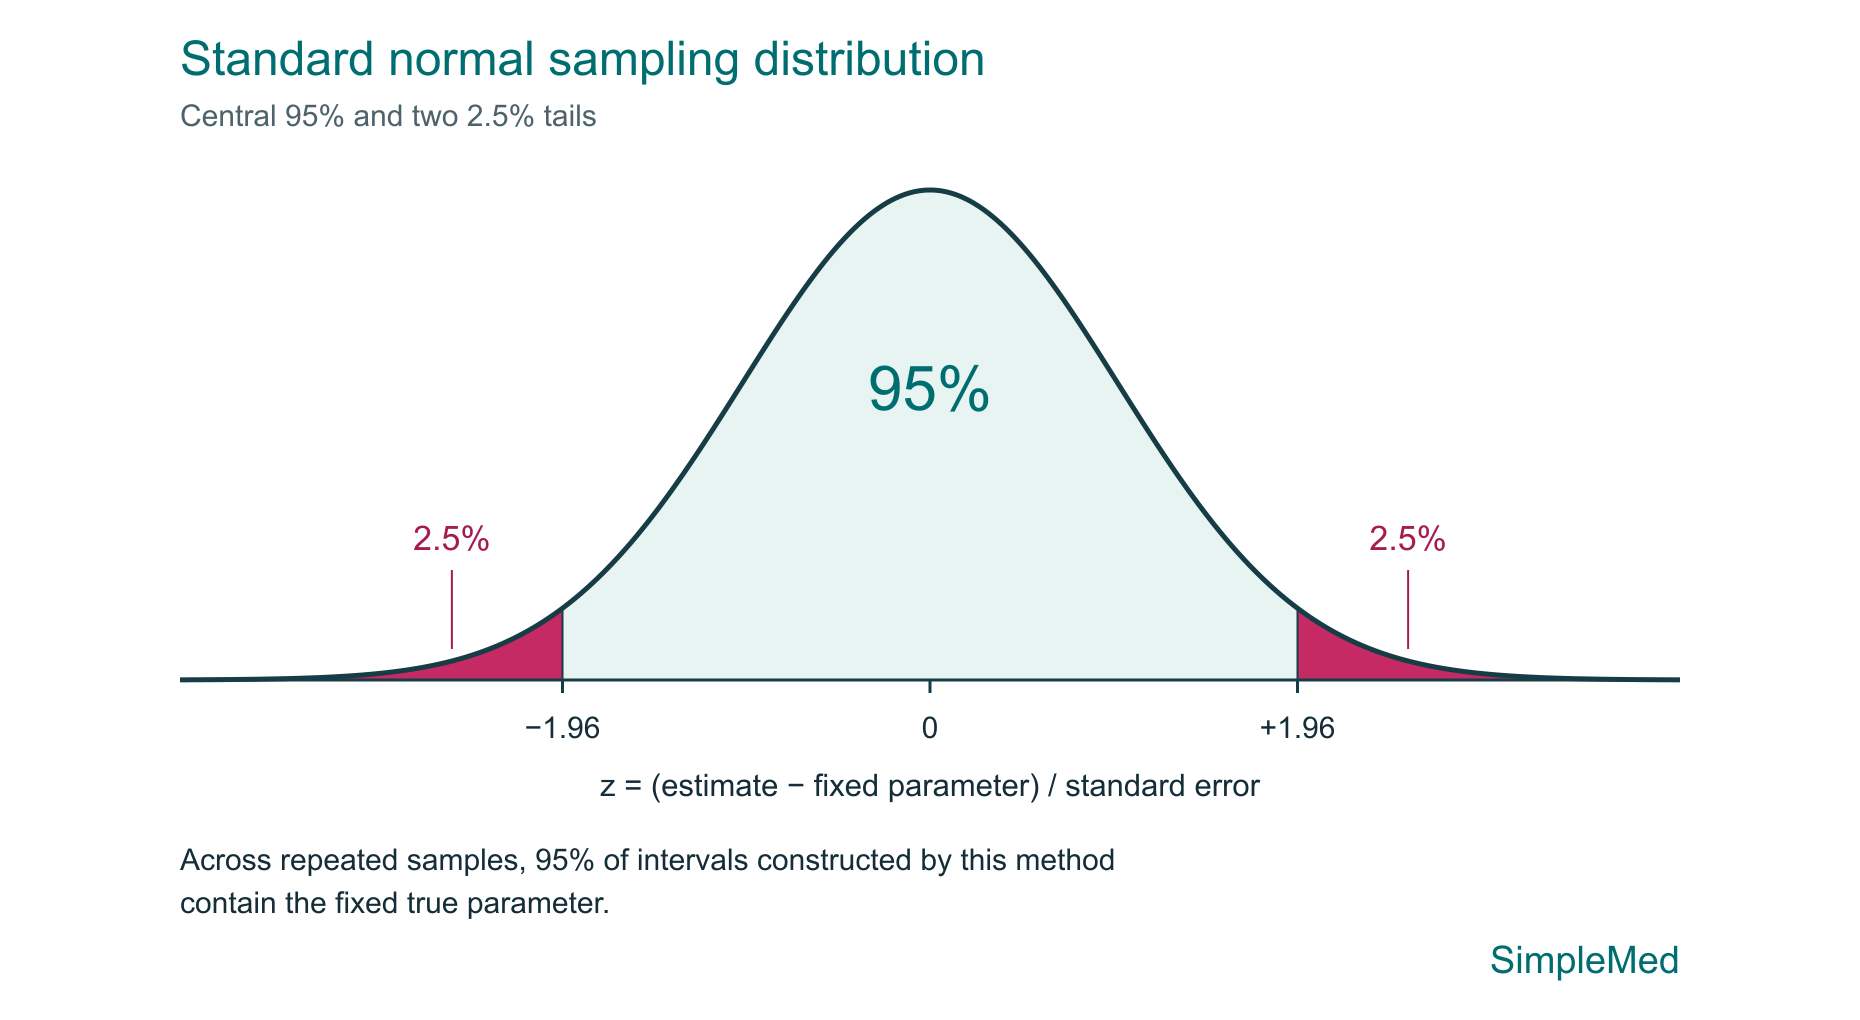
Graph — standard normal sampling distribution: approximately 95% lies between −1.96 and +1.96, with approximately 2.5% in each tail. Under the normal model, confidence-interval coverage refers to repeated samples; the true parameter is fixed.
SimpleMed — new mathematical plot (2026-10-01)
For a central nominal 95% interval based on the standard normal distribution, the upper critical value is approximately 1.96, leaving approximately 2.5% in each tail. Other interval constructions may use different critical values or avoid the normal approximation.
Now we must put the data into the equation:
So now we have the information to plug our data into the equation.
p̂ = 0.674 - this is the part that changes based on the proportion
Zα/2 ≈ 1.96 for this two-sided, normal-based 95% approximation
n = 500 - this changes depending on the sample size
Remember that the equation must be done twice: the first time using p̂ PLUS Zα/2 to find the upper bound of the confidence interval, and the second time using p̂ MINUS Zα/2 to find the lower bound of the confidence interval.
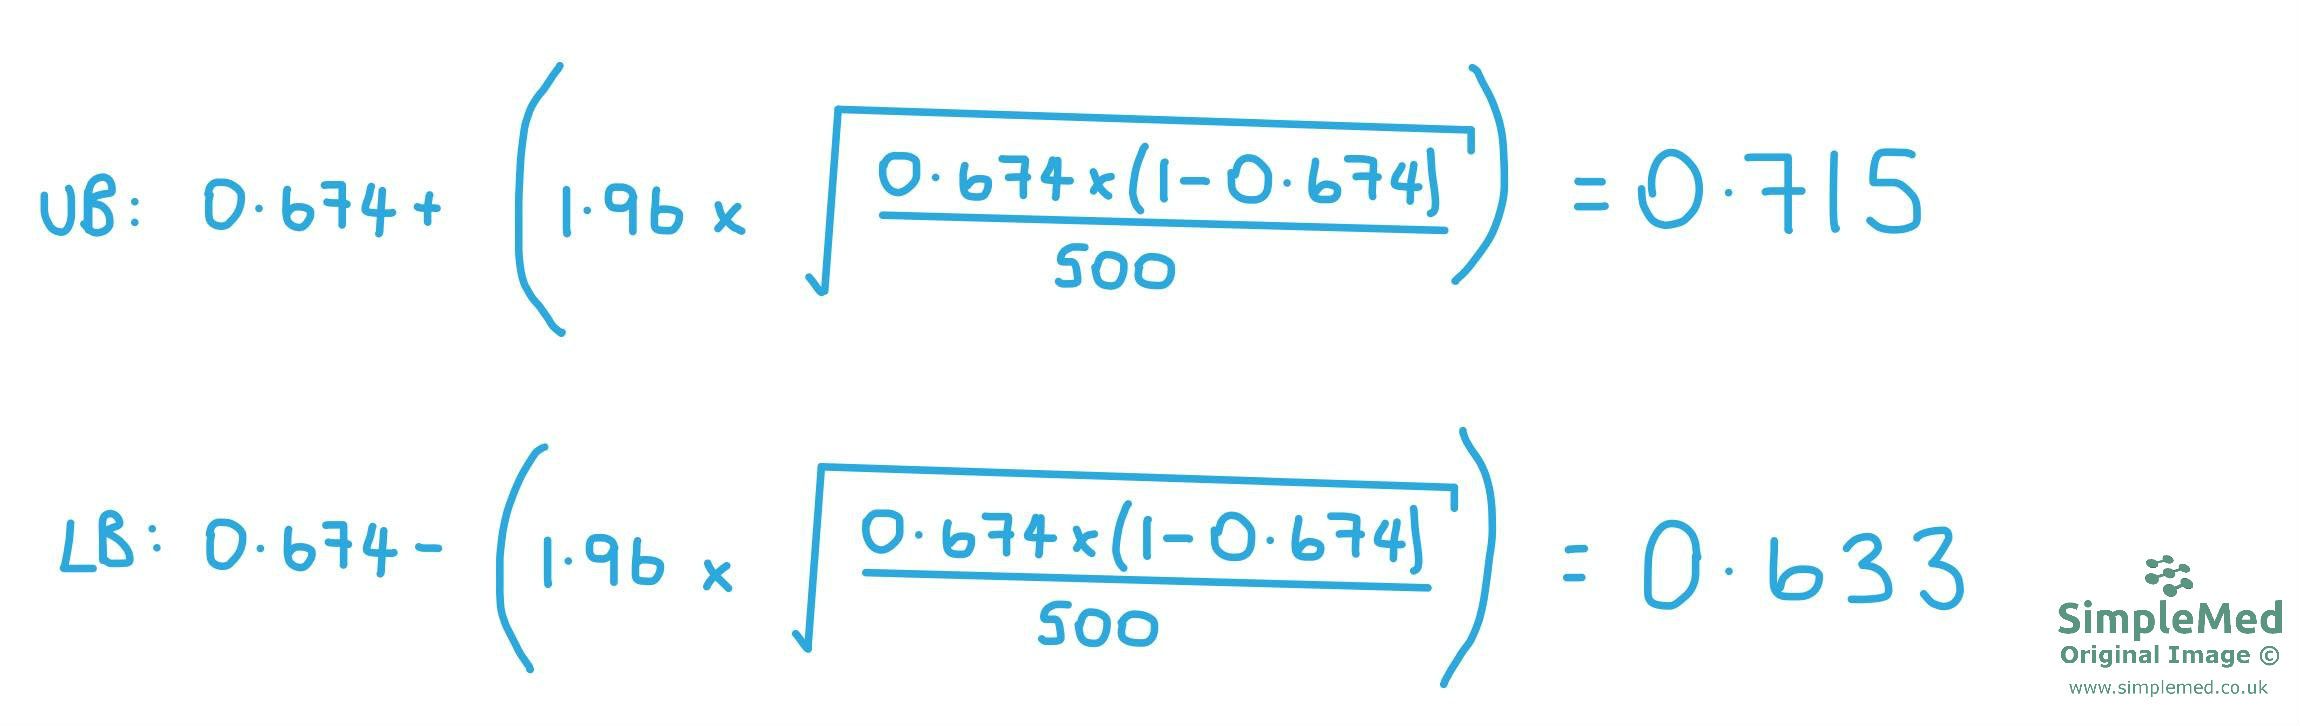
Diagram - shows the equations used to work out the upper bound (UB) and the lower bound (LB) of the confidence interval in our study.
SimpleMed original by Dr. Maddie Swannack
Working out Statistical Significance
Whether a study’s results are ‘statistically significant’ is a characteristic of the confidence interval.
If the value of the null hypothesis is within the confidence interval, the results are not significant, because the results of the study could indicate that ‘there is no difference’. This applies to all study designs that can have a confidence interval worked out (case control, cohort and cross sectional).
If a study is using a calculated ratio, the null hypothesis would be that the independent variable (the thing that is being changed in the study) has had no effect on the outcome. This is represented by the value of ‘1’, because no difference in a ratio is when the numbers are the same, aka the ratio is 1:1.
If the confidence interval includes the number 1 in this case, the true value could be 1, meaning there could be no difference. This means that the null hypothesis should not be rejected, and the correct phrasing of this is: “The number 1 is included in the confidence interval, meaning that the confidence interval is large enough to include the null hypothesis. This means there could be no difference, the null hypothesis cannot be rejected, and the results are not statistically significant.”
If a study is not using ratio but is using the difference between two numbers (so the numbers are subtracted one from the other) then the null hypothesis should be represented by 0. This is because when subtracting numbers, the ‘no difference’ value is 0.
For a difference between groups, the null value is 0. If the confidence interval includes 0, the corresponding two-sided test does not reject the null hypothesis at the matching significance level. The data remain compatible with no difference; this does not prove that the groups are equivalent or that there is no effect.
Interpret a confidence interval against the null value: 1 for a ratio and 0 for a difference. The usual symmetric Wald interval is centred on its point estimate, but transformed, percentile and bias-corrected intervals use different constructions and may be asymmetric. Containment of the sample estimate is not a universal definition of a confidence interval and is not the test of statistical significance.
Examples of Confidence Intervals
A case control study classifies patients based on their disease state (lung cancer or not lung cancer) and investigates past exposure.
The results are as follows:

The odds ratio is ad ÷ bc = (15 × 27) ÷ (38 × 20) = 0.5329 to four decimal places.
For this case-control example, the error factor is e ^ {2 × √(1/15 + 1/38 + 1/20 + 1/27)} = 2.3363. The multiplier 2 approximates 1.96 for a normal-based 95% interval. Because the exponent is positive, the error factor is greater than 1.
The upper confidence limit is OR × EF = 0.5328947 × 2.3363131 = 1.2450.
The lower confidence limit is OR ÷ EF = 0.5328947 ÷ 2.3363131 = 0.2281. Calculate with unrounded values and round only the final limits.
Using the illustrated approximation, the confidence interval runs from 0.2281 to 1.2450. It includes the null odds ratio of 1, so the data remain compatible with no association.
The confidence interval for the odds ratio includes 1, the null value for no association. The result is therefore not statistically significant in the corresponding two-sided test at the matching level. We fail to reject the null hypothesis; we do not establish that there is no association.
A cohort study classifies people based on their exposure state (second-hand smoke) and investigates the occurrence of lung cancer.
The results are as follows:
In the exposed group, 127 of 295 participants developed lung cancer. If the stated average of 8 person-years is the average time at risk per participant, the total is 295 × 8 = 2,360 person-years. The incidence rate is then 127 ÷ 2,360 = 0.0538 cases per person-year, or 53.8 per 1,000 person-years.
In the unexposed group: 52/229 people developed lung cancer during follow up. The incidence rate should be calculated using the total person-years at risk in this group.
An incidence rate ratio compares the exposed and unexposed incidence rates. The unexposed group’s total person-time is not supplied here, so a numerical rate ratio cannot be calculated from these data.
For this worked rate-ratio example, using 2 as a rounded approximation to 1.96 in the illustrated normal approximation, the error factor is e ^ {2 × √(1/d1 + 1/d2)}, where d1 and d2 are the event counts. With 127 and 52 cases, the factor is 1.3900. These are event counts, not the four cells from the case-control example.
Once both groups’ person-time is available, calculate the rate ratio and multiply it by the error factor for the upper confidence limit.
Divide the rate ratio by the error factor for the lower confidence limit. A positive-exponent error factor is greater than 1, so division gives the lower limit and multiplication gives the upper limit.
The missing unexposed person-time prevents a numerical rate-ratio confidence interval from being reported for this example.
The null value for a rate ratio is 1. Statistical significance can be assessed against it once the interval has been calculated; these incomplete rate data do not support a conclusion about significance.
Edited by: Dr. Marcus Judge and Dr. Ben Appleby
- 8983