
Next Lesson - Lipid Metabolism and Transport
Core
The oxygen-dependent pathways ultimately rely on a constant supply of oxygen because the reducing equivalents (the electrons carried by NADH and FADH2) generated earlier are re-oxidised at the mitochondrial membrane to produce ATP. Without oxygen, oxidative phosphorylation cannot proceed and these pathways slow or stop.
These processes occur after the completion of Glycolysis, of which the final product is pyruvate. They include the Link reaction, the Krebs cycle and Oxidative Phosphorylation.

Diagram - The Link Reaction. Note the modulatory enzyme pyruvate dehydrogenase
SimpleMed original by Dr. Maddie Swannack
The Link reaction, seen above, ‘links’ Glycolysis to the Krebs Cycle by turning pyruvate (the end product of Glycolysis) into Acetyl CoA, and is irreversible due to the loss of carbon dioxide.
Pyruvate dehydrogenase is the multi-enzyme complex required for this reaction. It requires several co-factors (helper molecules) to work effectively. Four come from B vitamins: thiamine (B1) for thiamine pyrophosphate, riboflavin (B2) for FAD, niacin (B3) for NAD+ and pantothenic acid (B5) for coenzyme A. The fifth, lipoic acid, is made in the body. A deficiency in this enzyme, or in one of its co-factors such as thiamine (vitamin B1), can lead to lactic acidosis (a build-up of lactic acid that makes the blood too acidic). Pyruvate cannot then be turned into Acetyl CoA, so the anaerobic pathway must work harder to produce energy and lactic acid builds up.
Pyruvate dehydrogenase is allosterically regulated (switched up or down by molecules binding away from its active site) by a number of compounds. It is also switched off by a kinase (an enzyme that adds a phosphate group) and back on by a phosphatase (an enzyme that removes it), and several of the compounds below act partly through these two enzymes:
- It is activated by high concentrations of: pyruvate, NAD+, ADP and insulin: these are all present when the cell's energy is low or glucose is plentiful.
- It is inhibited by high concentrations of: Acetyl CoA, NADH, ATP and citrate: these are all present when the cell's energy is high or glucose is scarce.
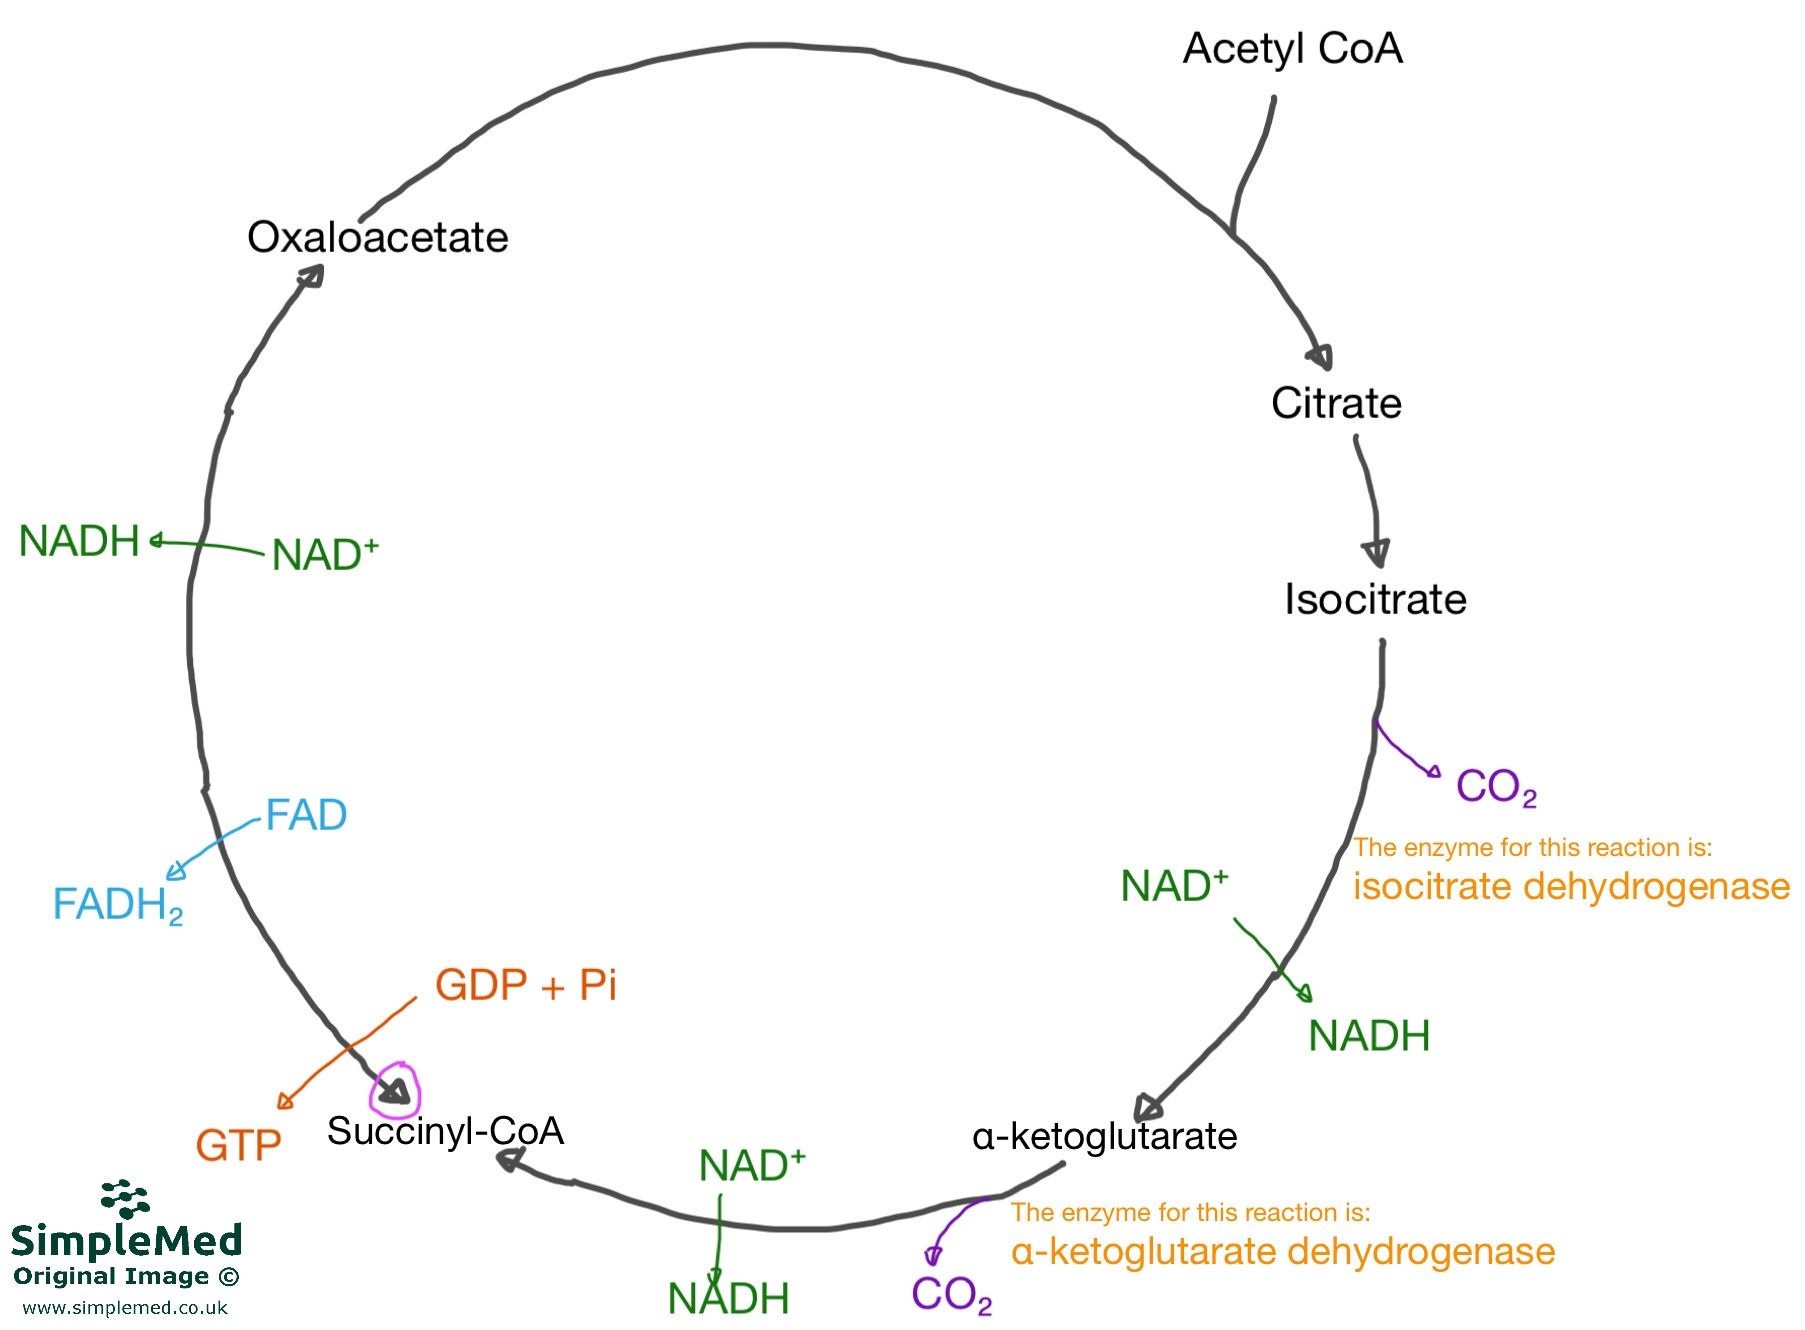
Diagram - The Krebs cycle, showing the basic intermediates, the products of each reaction and the key enzymes involved. Acetyl CoA from the Link Reaction enters and is combined with oxaloacetate to produce citrate
SimpleMed original by Dr. Maddie Swannack
Per glucose molecule (2 cycles of the Krebs Cycle), the Krebs Cycle produces:
- 6x NADH
- 2x FADH2
- 2x GTP (guanosine triphosphate, an energy molecule similar to ATP)
The pink-circled arrow on the diagram of the Krebs Cycle above highlights that the reaction between the four-carbon (C4) intermediate and oxaloacetate is reversible, because there is no loss of carbon dioxide in this step. However, it would be rare for the reaction to reverse.
Therefore, so far in the metabolism of glucose:
- All C-C bonds have been broken and oxidised to CO2
- All C-H bonds have been broken and transferred H+ and e- to NAD+/FAD
The FADH2 and NADH produced in the Krebs cycle (as well as the NADH produced by Glycolysis) provide reducing power for oxidative phosphorylation, which occurs at the mitochondrial membrane.

Diagram - The process of Oxidative Phosphorylation occurring at the mitochondrial membrane. Note the blue channel, ATP synthase, through which the H+ ions travel back down their gradient, driven by the proton motive force, to convert ADP to ATP
SimpleMed original by Dr. Maddie Swannack
NADH and FADH2 from Glycolysis and the Krebs Cycle are re-oxidised with O2 at the mitochondrial membrane to create energy. The electrons from the NADH and FADH2 are donated to the electron transport chain within the mitochondrial membrane. As these electrons travel down the energy levels through the electron transport chain, they cause the release of energy. At the end of the chain, they combine with free oxygen (known as the terminal electron acceptor) to form water.
The energy from this oxidation reaction is used to power proton pumps (Complexes I, III and IV of the electron transport chain) that move H+ from the matrix of the mitochondria to the intermembrane space (the gap between the inner and outer mitochondrial membranes). This creates a potential difference of approximately -180mV across the membrane. This potential difference, together with the H+ concentration gradient (a difference in pH) across the membrane, is called the proton motive force.
The potential difference created attracts the H+. Under normal coupled conditions (electron transport is linked to ATP production), their main path back into the mitochondrial matrix is via the ATP synthase enzyme (blue on the diagram above). Their movement back through this enzyme channel leads to the phosphorylation of ADP to ATP, as seen below.

Diagram - The conversion of ADP to ATP by ATP synthase within the mitochondrial membrane wall
SimpleMed original by Dr. Maddie Swannack
ATP synthase normally runs in the direction of ATP synthesis, powered by the H+ gradient. The ATP yield depends on the electron carrier (about 2.5 ATP per NADH and 1.5 per FADH2):
- 2 moles of NADH produces 5 moles of ATP
- 2 moles of FADH2 produces 3 moles of ATP
ATP synthase is regulated by the concentration of ATP. In high [ATP], low [ADP] states, movement of H+ through ATP synthase stops, so the proton gradient builds up and electron transport slows (respiratory control: respiration speeds up when ADP is available and slows when it is not).
Inhibitors block electron transport at specific points in the chain, so less energy is available to pump protons and the proton gradient falls. An example of an ETC inhibitor is cyanide, which binds to cytochrome c oxidase (Complex IV) and so blocks the passing of electrons to oxygen, the terminal electron acceptor. Cells can then no longer use oxygen to make ATP, which is why cyanide is lethal.
Uncouplers dissipate (lose as heat) the proton gradient by increasing the permeability of the membrane to H+.
In brown adipose tissue (brown fat, which burns fuel to make heat; found in newborns and, in adults, mainly in the neck, above the collarbones, beside the spine and in the chest), uncoupling proteins (notably thermogenin, also called uncoupling protein 1 or UCP-1) are activated by noradrenaline, which is released when the body temperature falls. Noradrenaline triggers lipolysis (the breakdown of fat, which releases fatty acids). The fatty acids activate UCP-1, a channel in the inner mitochondrial membrane that lets protons flow back across it, so the proton gradient (proton motive force) is dissipated as heat rather than being used to create ATP.
Overall, approximately 30 to 32 moles of ATP are produced per glucose, depending on the shuttle systems used (the routes that carry electrons from NADH made in the cytoplasm into the mitochondrion).
Edited by: Dr. Ben Appleby and Dr. Marcus Judge
Reviewed by: Dr. Marcus Judge
- 9704