
Next Lesson - Molecular Techniques for Medics
Core
In chemical reactions, there is a minimum amount of energy that the substrates must have to allow the reaction to take place and lead to the generation of the products. This is called the activation energy.
Enzymes are biological catalysts that increase the rate of the reaction by lowering the activation energy required for the reaction to take place. Other ways of increasing the rate of the reaction are:
- Increased temperature - increases the number of molecules present with the activation energy.
- Increased concentration of substrates - increases the likelihood of molecular collisions.

Diagram - Graph of how enzymes reduce activation energy in a reaction
SimpleMed original by Dr. Peter Parkinson
There are a number of features that enzymes have that enable them to carry out their function:
- Highly specific - enzymes have a specific shape that is complementary to a specific substrate and therefore only work on a specific reaction.
- Increase rate of reaction - by lowering the activation energy required for the reaction to take place, more molecules will be able to react together and the reaction can take place.
- Enzymes are usually proteins - most enzymes are sensitive to temperature changes and can become denatured (lose their shape and stop working) at high temperatures, as well as having reduced activity at lower temperatures.
- Unchanged after the reaction - the structure of the enzyme is not changed by the reaction taking place therefore can be re-used in further reactions.
- Can require associated cofactors - cofactors can be a prosthetic group, which are permanently bound or a metal ion, vitamin or vitamin-made molecule (coenzyme), which are temporarily bound.
- Does not alter the reaction equilibrium - enzymes do not change the free energy (the energy available to do work) of the substrates or products, so the reaction equilibrium between them is unchanged. The equilibrium depends only on the free energy of the substrates and products.
The active site of an enzyme is where the substrate binds to and where the reaction takes place. There are some features of the active site:
- The active site only makes up a small part of the enzyme. Most enzymes are more than 100 amino acids long. The active site is formed by several amino acids that are brought together by the folding of the protein.
- Active sites are clefts or crevices where the substrate binds and water is excluded.
- The amino acids that form the active site are found at different points along the polypeptide's primary sequence (the order of amino acids in the chain).
- The bonds between the substrates and enzyme are weak, non-covalent bonds and the binding is not too tight. The bonds must be weak enough to allow the reaction to proceed and for products to be released once the reaction is completed.
There are two hypotheses as to how enzymes fit their specific substrate:
- The active site of the enzyme is complementary in shape to the substrate. There is no further modification to the active site or substrate, just as a key fits into a lock.
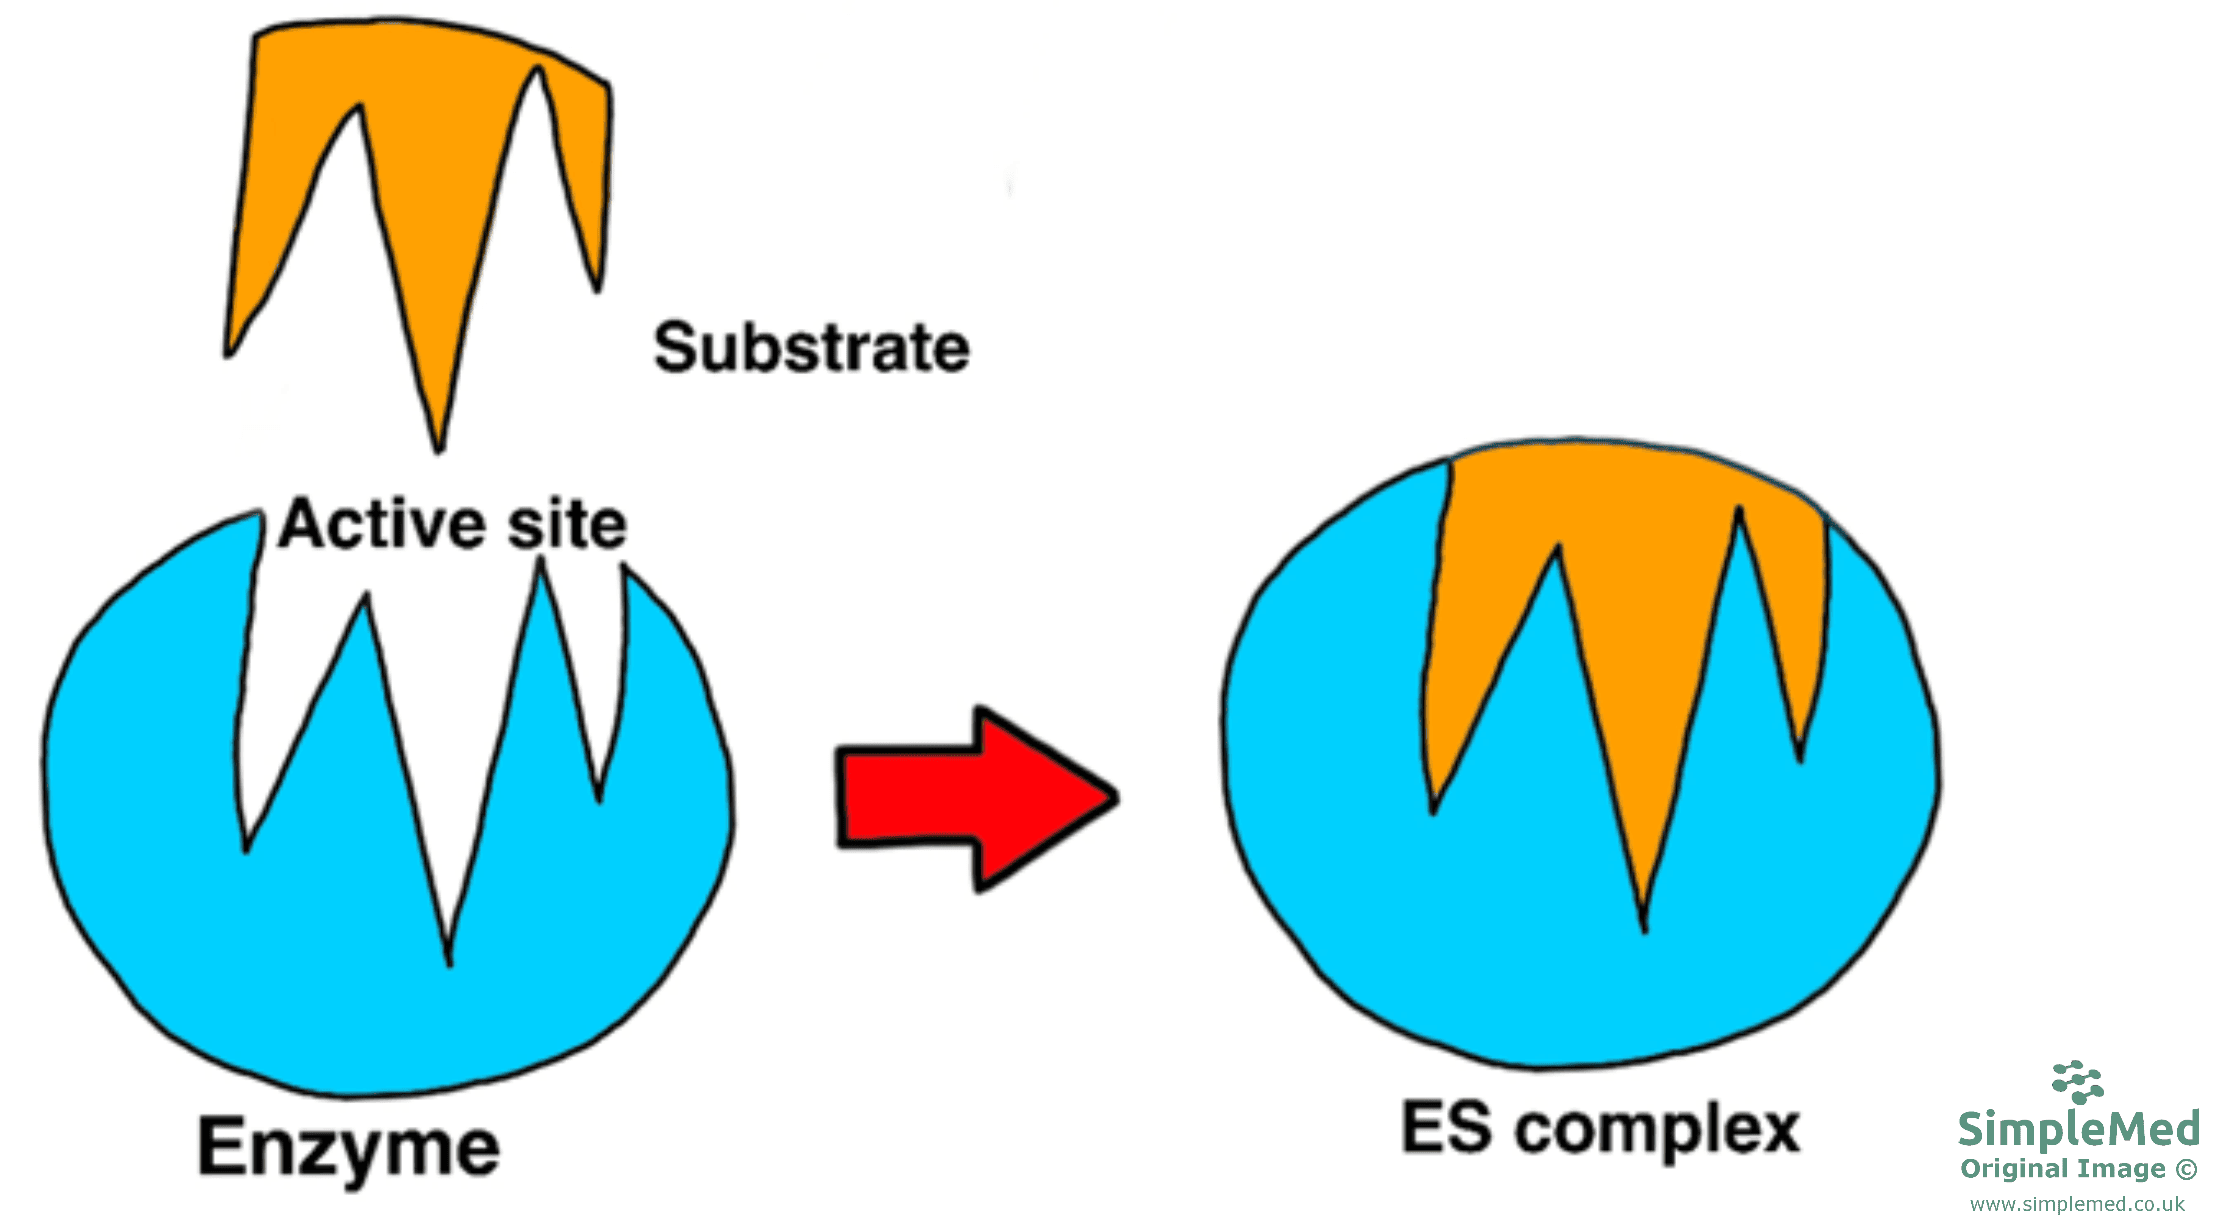
Diagram - The Lock and Key hypothesis
SimpleMed original by Dr. Peter Parkinson
- The active site only becomes complementary in shape to the substrate once the substrate has bound to the active site.
- This model assumes that the active site is flexible and is similar to someone wearing a glove: the glove changes shape to fit the hand.
- Once the products have formed and moved away, the active site returns back to its original shape.
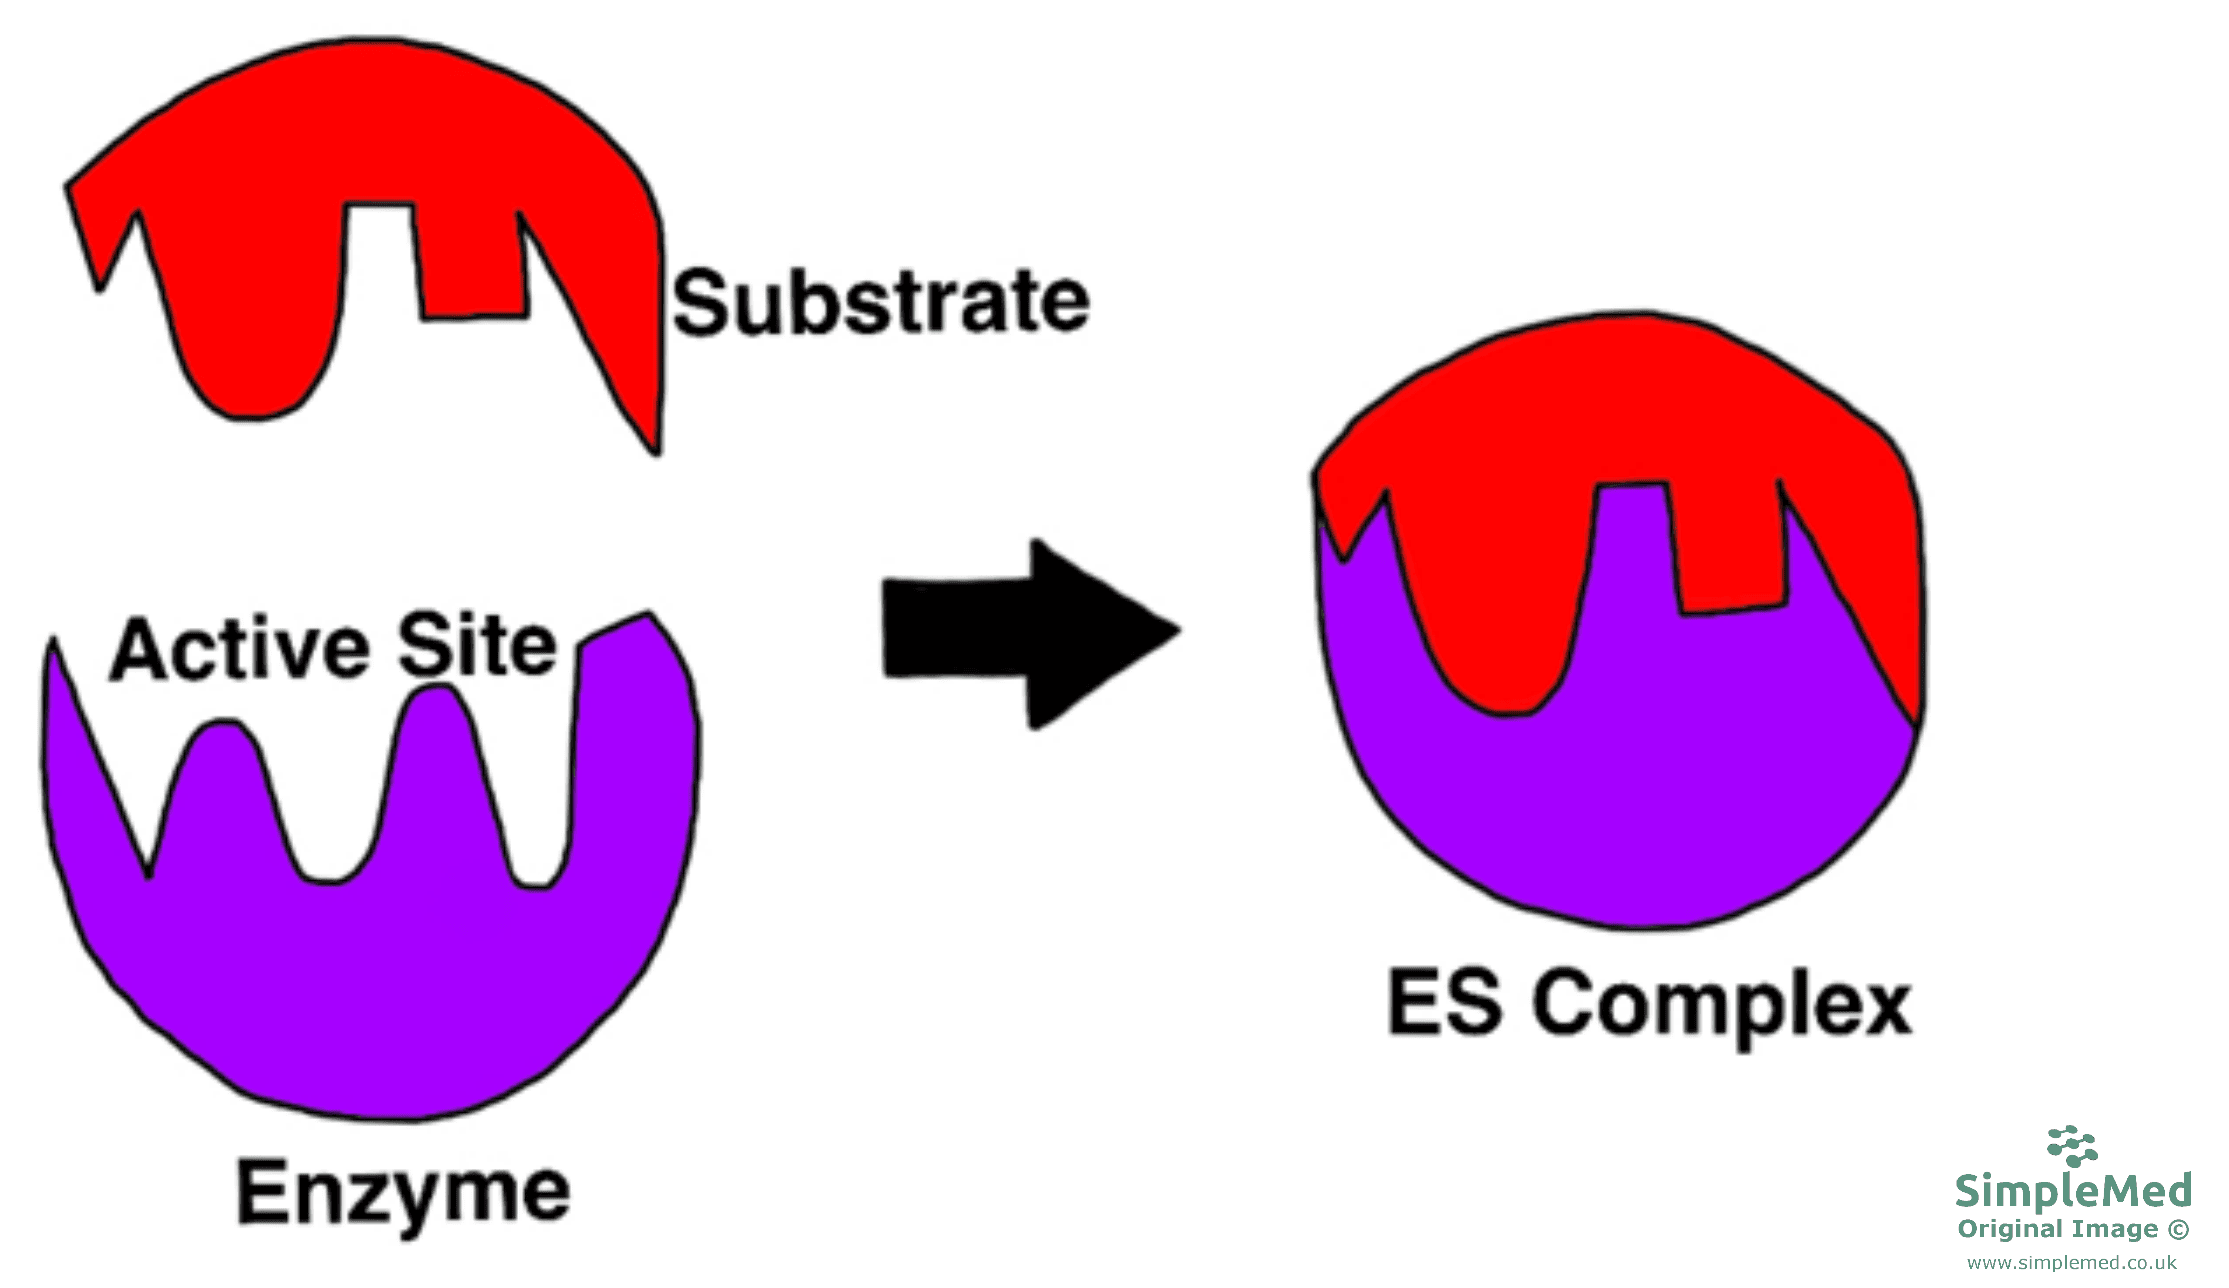
Diagram - The Induced Fit hypothesis
SimpleMed original by Dr. Peter Parkinson
The Concentration of Substrate Decreases Over Time
- At the start of the reaction, the substrate concentration is at its highest. However, as the substrates are consumed in the reaction, the concentration of substrates decreases as the concentration of product increases.
Enzymes are Sensitive to Temperature
- The catalytic activity of human enzymes is at its greatest at an optimal temperature close to normal body temperature (about 37°C; normal body temperature varies a little between people, through the day and with where it is measured).
- Above the optimal temperature, the bonds within the structure of the enzyme begin to break and the enzyme begins to denature therefore the rate of reaction begins to slow down.
- Some enzymes of different organisms have evolved to work at extremes of temperature. For example, the enzyme shown in blue on the graph could be from an organism living in the Arctic. The enzyme shown in red could be taken from an organism living in the hot springs of Yellowstone National Park in U.S.A.

Diagram - Graph showing the activity of different enzymes at different temperatures
SimpleMed original by Dr. Peter Parkinson
Different Enzymes Have Different Optimal pH
- A change in pH can change the ionisation state (whether a group carries an electrical charge) of the R groups (the side chains) of the amino acids present in the structure of the enzyme. This change in ionisation state can change the structure of enzyme and can lead to the enzyme becoming denatured.
- The optimal pH is not the same for each enzyme, as seen in the graph. The enzyme shown in green could represent pepsin, which breaks down proteins in the acidic lumen (the space inside) of the stomach, whereas the enzyme shown in red could represent hexokinase, present in the cytosol (the fluid inside the cell) of human cells where the pH is neutral.

Diagram - Graph showing the activity of different enzymes with changes in pH
SimpleMed original by Dr. Peter Parkinson
We can display enzyme kinetic information using graphs by showing reaction rate as a function of substrate concentration. By doing this, the graphs show that an enzyme catalysed reaction reaches a maximum velocity.
The Michaelis-Menten model describes that a specific complex between an enzyme and the substrates is an essential intermediate step in the overall reaction.
The Michaelis-Menten equation predicts that a plot of initial velocity (V0) versus concentration of substrate will produce a rectangular hyperbola (a curve that rises steeply, then flattens out). It is important to remember that not all enzymes obey the Michaelis-Menten model.

Diagram - Graph showing reaction velocity versus substrate concentration with a rectangular hyperbola
SimpleMed original by Dr. Peter Parkinson
Vmax = maximal rate when all enzyme active sites are saturated with substrate.
Km (the Michaelis constant) = substrate concentration that gives half maximal velocity.
The value of Km is often used as an indicator of the affinity of the enzyme for its substrate (how strongly the enzyme binds the substrate), although it also reflects aspects of the reaction kinetics.
- High Km = Low affinity for the substrate
- Low Km = High affinity for the substrate
A low Km means that the enzyme has a high affinity for the substrate, so less substrate is needed to give half the maximal velocity of the reaction.
Vmax and V0 values are rates as they are measured in amounts per unit time.
1 unit = amount of enzyme that converts 1 μmol of substrate per min under standard conditions.
Enzyme activity is expressed as a standardised rate, per litre of serum or per gram of tissue.
It is important to remember that the rate of an enzyme catalysed reaction is proportional to the concentration of enzyme present. If you double the concentration of enzyme, the rate will double (but the standardised rate will not).
The Michaelis-Menten plot can be rearranged to change the rectangular hyperbola plot to a linear plot.
A linear plot allows easier estimation of Vmax and Km values as well as easier comparison of two or more enzymes.
On the plot:
- The x-intercept equals -1/Km. This means a more negative x-intercept indicates a low Km and high affinity for the substrate.
- The y-intercept on the plot indicates 1/Vmax. This means a low y-intercept value will indicate a high Vmax value so fast maximal rate.
- The slope of the plot is calculated by Km/Vmax.

Diagram - A Lineweaver-Burk Plot
SimpleMed original by Dr. Peter Parkinson
An inhibitor is a molecule that prevents or slows down a reaction catalysed by an enzyme and many drugs can be inhibitors. An inhibitor can bind irreversibly or reversibly. If the inhibitor binds reversibly, it can be either competitive or non-competitive.

Diagram - Graph showing how the different inhibitors affect the reaction rate as the substrate concentration increases
SimpleMed original by Dr. Thomas Burnell
The inhibitor forms very tight bonds with the enzyme usually through covalent bonds. This prevents enzyme-substrate complexes from forming. The enzyme is now permanently inactivated and can no longer function.
Examples include:
- Nerve agents (often called nerve gases) such as sarin - bind to acetylcholinesterase, the enzyme that breaks down acetylcholine (the chemical messenger that passes signals between nerves, and from nerves to muscles). Acetylcholine then builds up in the synapses (the gaps where nerves pass signals on), which is the main cause of the toxic effects.
- Penicillin - the antibiotic works by preventing the action of an enzyme responsible for the production of the bacterial cell wall therefore water can enter the bacteria leading to swelling and cell lysis (the cell bursts).
Competitive, Reversible Inhibitor
A competitive inhibitor is similar in shape to the substrate and will bind to the active site on the enzyme through non-covalent bonds. This reduces the proportion of substrate bound to the enzyme and as the inhibitor is competing with the substrate for the active site, the Km increases hence affinity decreases.
The Vmax is unaffected because adding enough substrate overcomes the effect of the competitive inhibitor.
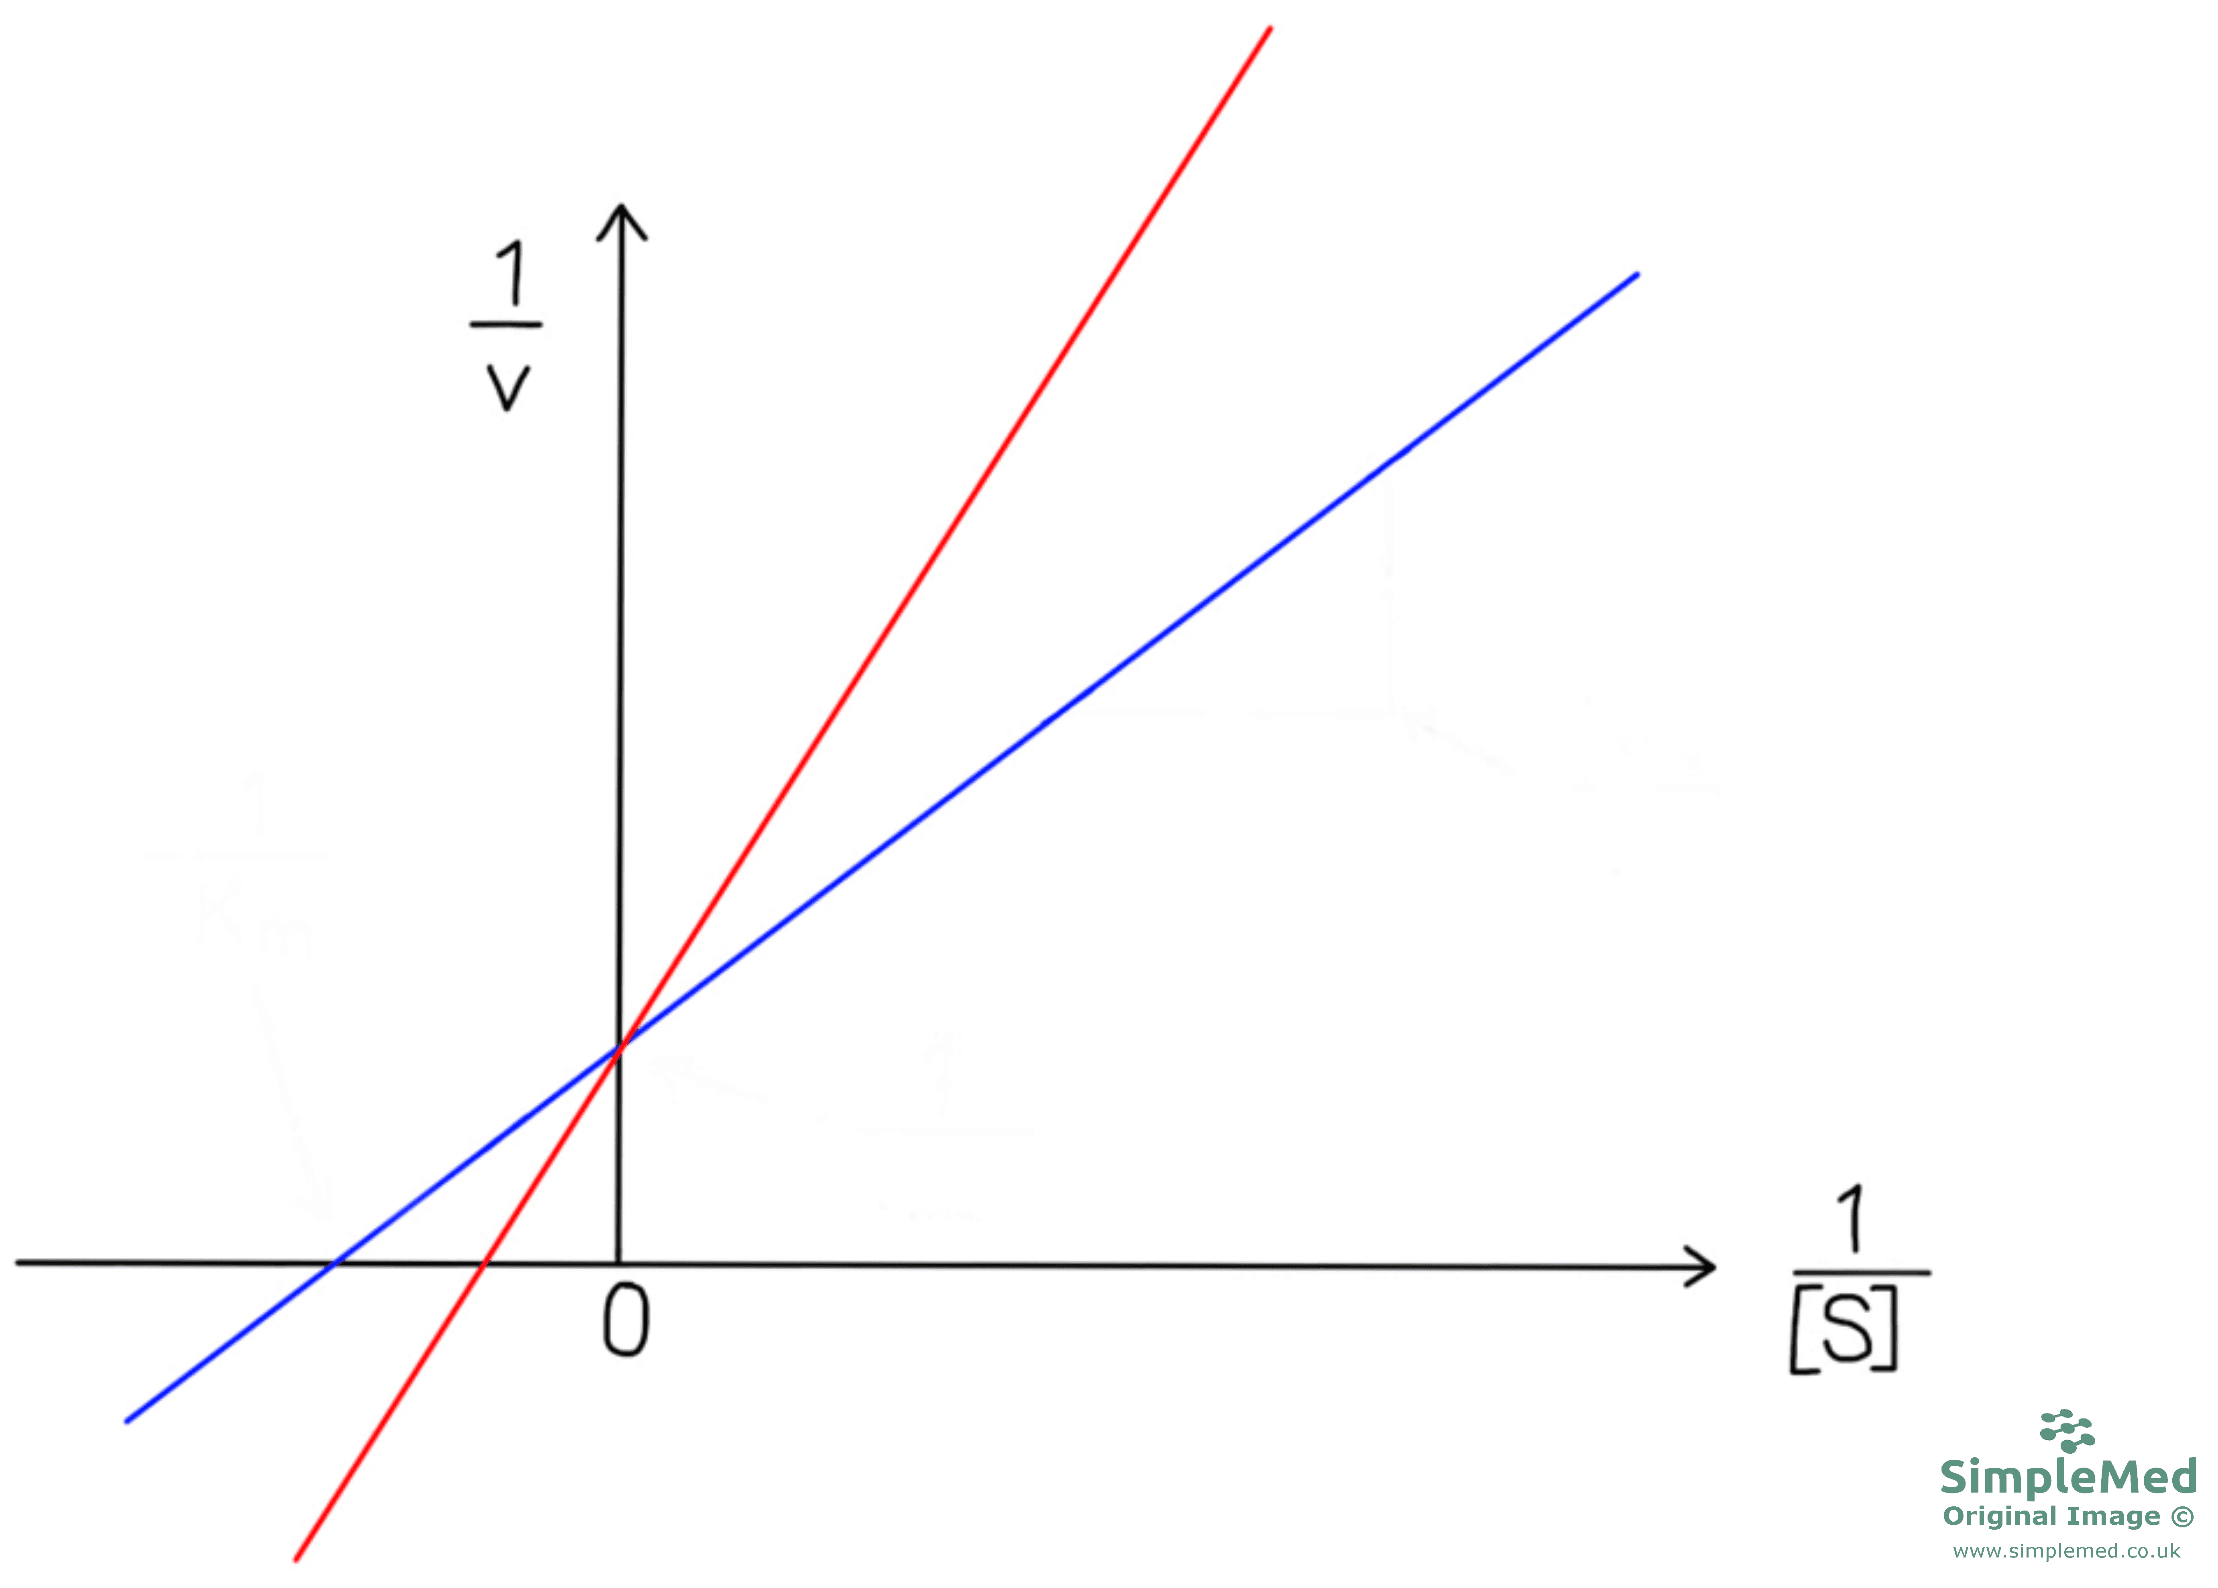
Diagram - Graph showing reversible, competitive inhibition. In blue there is no inhibitor while in red there is a competitive inhibitor. The Km has increased whilst the Vmax is unaffected once the competitive, reversible inhibitor is added
SimpleMed original by Dr. Peter Parkinson
Non-Competitive, Reversible Inhibitor
Non-competitive inhibitors bind at the allosteric site (site other than the active site) and change the overall 3-D structure of the enzyme. The substrate can still bind with the same affinity, but the enzyme no longer has the optimal arrangement to catalyse the reaction and generate products. Therefore, the Vmax is reduced as the enzyme can no longer catalyse the reaction with the same efficiency. The Km is unaffected in pure non-competitive inhibition.
Unlike competitive inhibition, the effect of the inhibition cannot be overcome by increasing the concentration of the substrate.
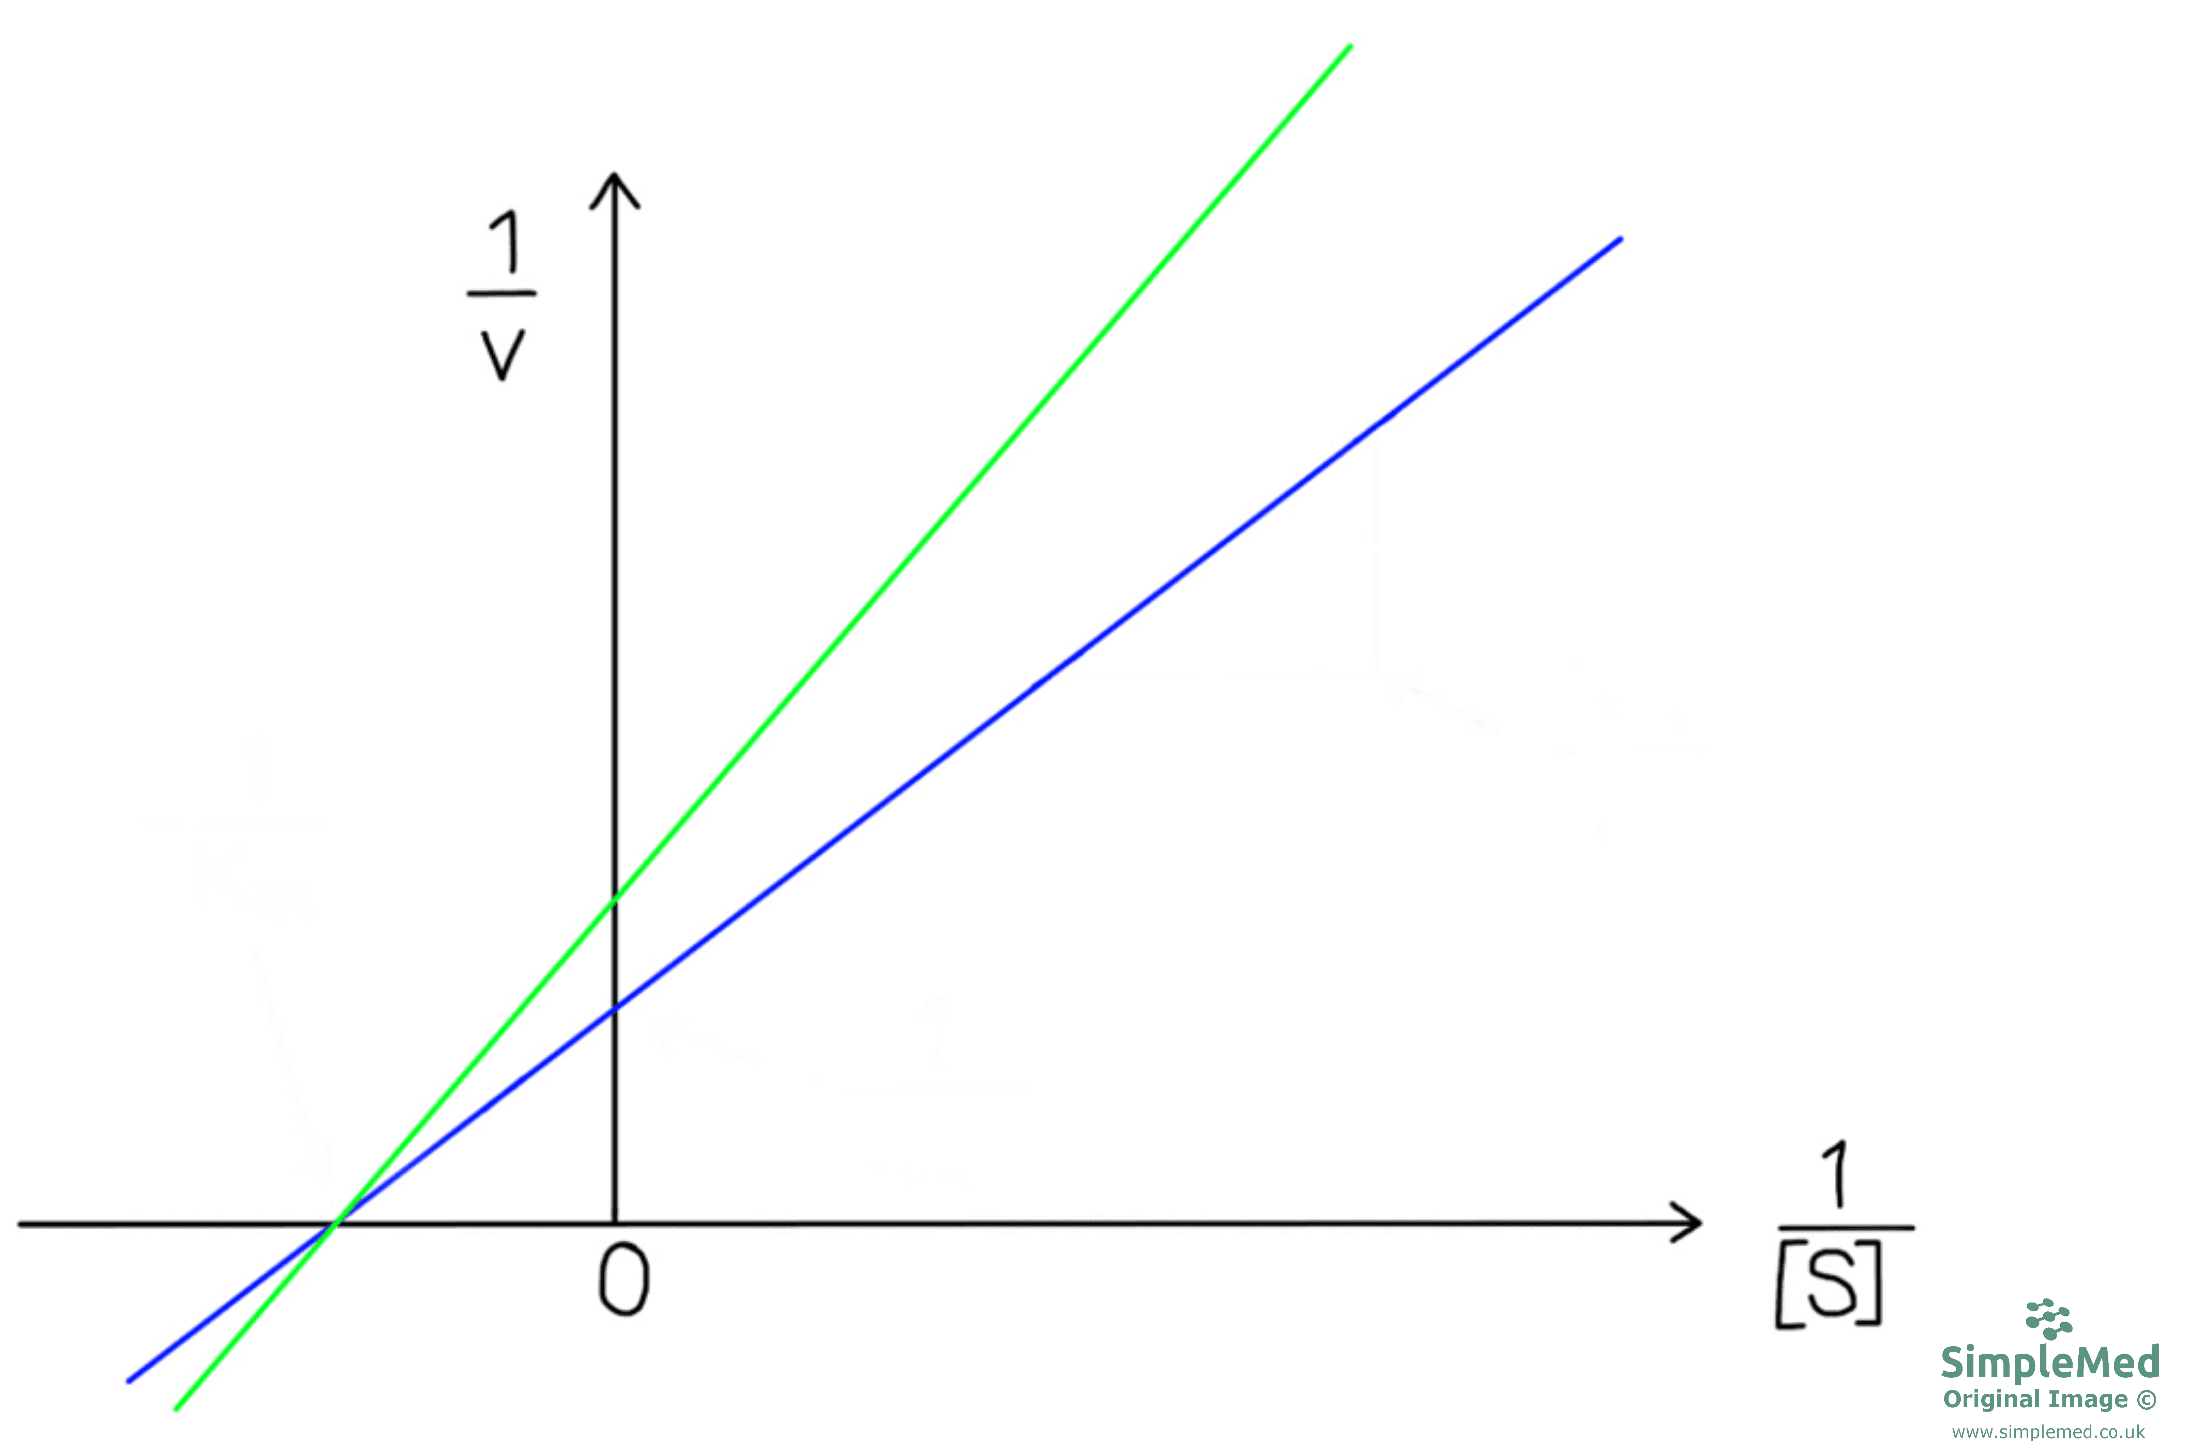
Diagram - Graph showing a reversible, non-competitive inhibition. In blue there is no inhibitor present while in green there is a non-competitive inhibitor. The Vmax has reduced once non-competitive, reversible inhibitor is added while the Km is unaffected
SimpleMed original by Dr. Peter Parkinson
Short Term Regulation of Proteins
Substrate and Product Concentration
- The availability of substrate affects the rate of the reaction. If the substrate runs low, the enzyme has less to work on, so the reaction slows down or stops.
- Isoenzymes are different forms of the same enzyme that catalyse the same reaction but are usually encoded by different genes. They have different kinetic properties such as increased/decreased affinity.
- Example of isoenzymes are hexokinase and glucokinase. These enzymes catalyse the first step of glycolysis. Hexokinase is present in all cells of the body and has a high affinity for glucose. Glucokinase is found mainly in liver cells and in the beta cells of the pancreas (the cells that make insulin), and has a lower affinity for glucose in comparison.
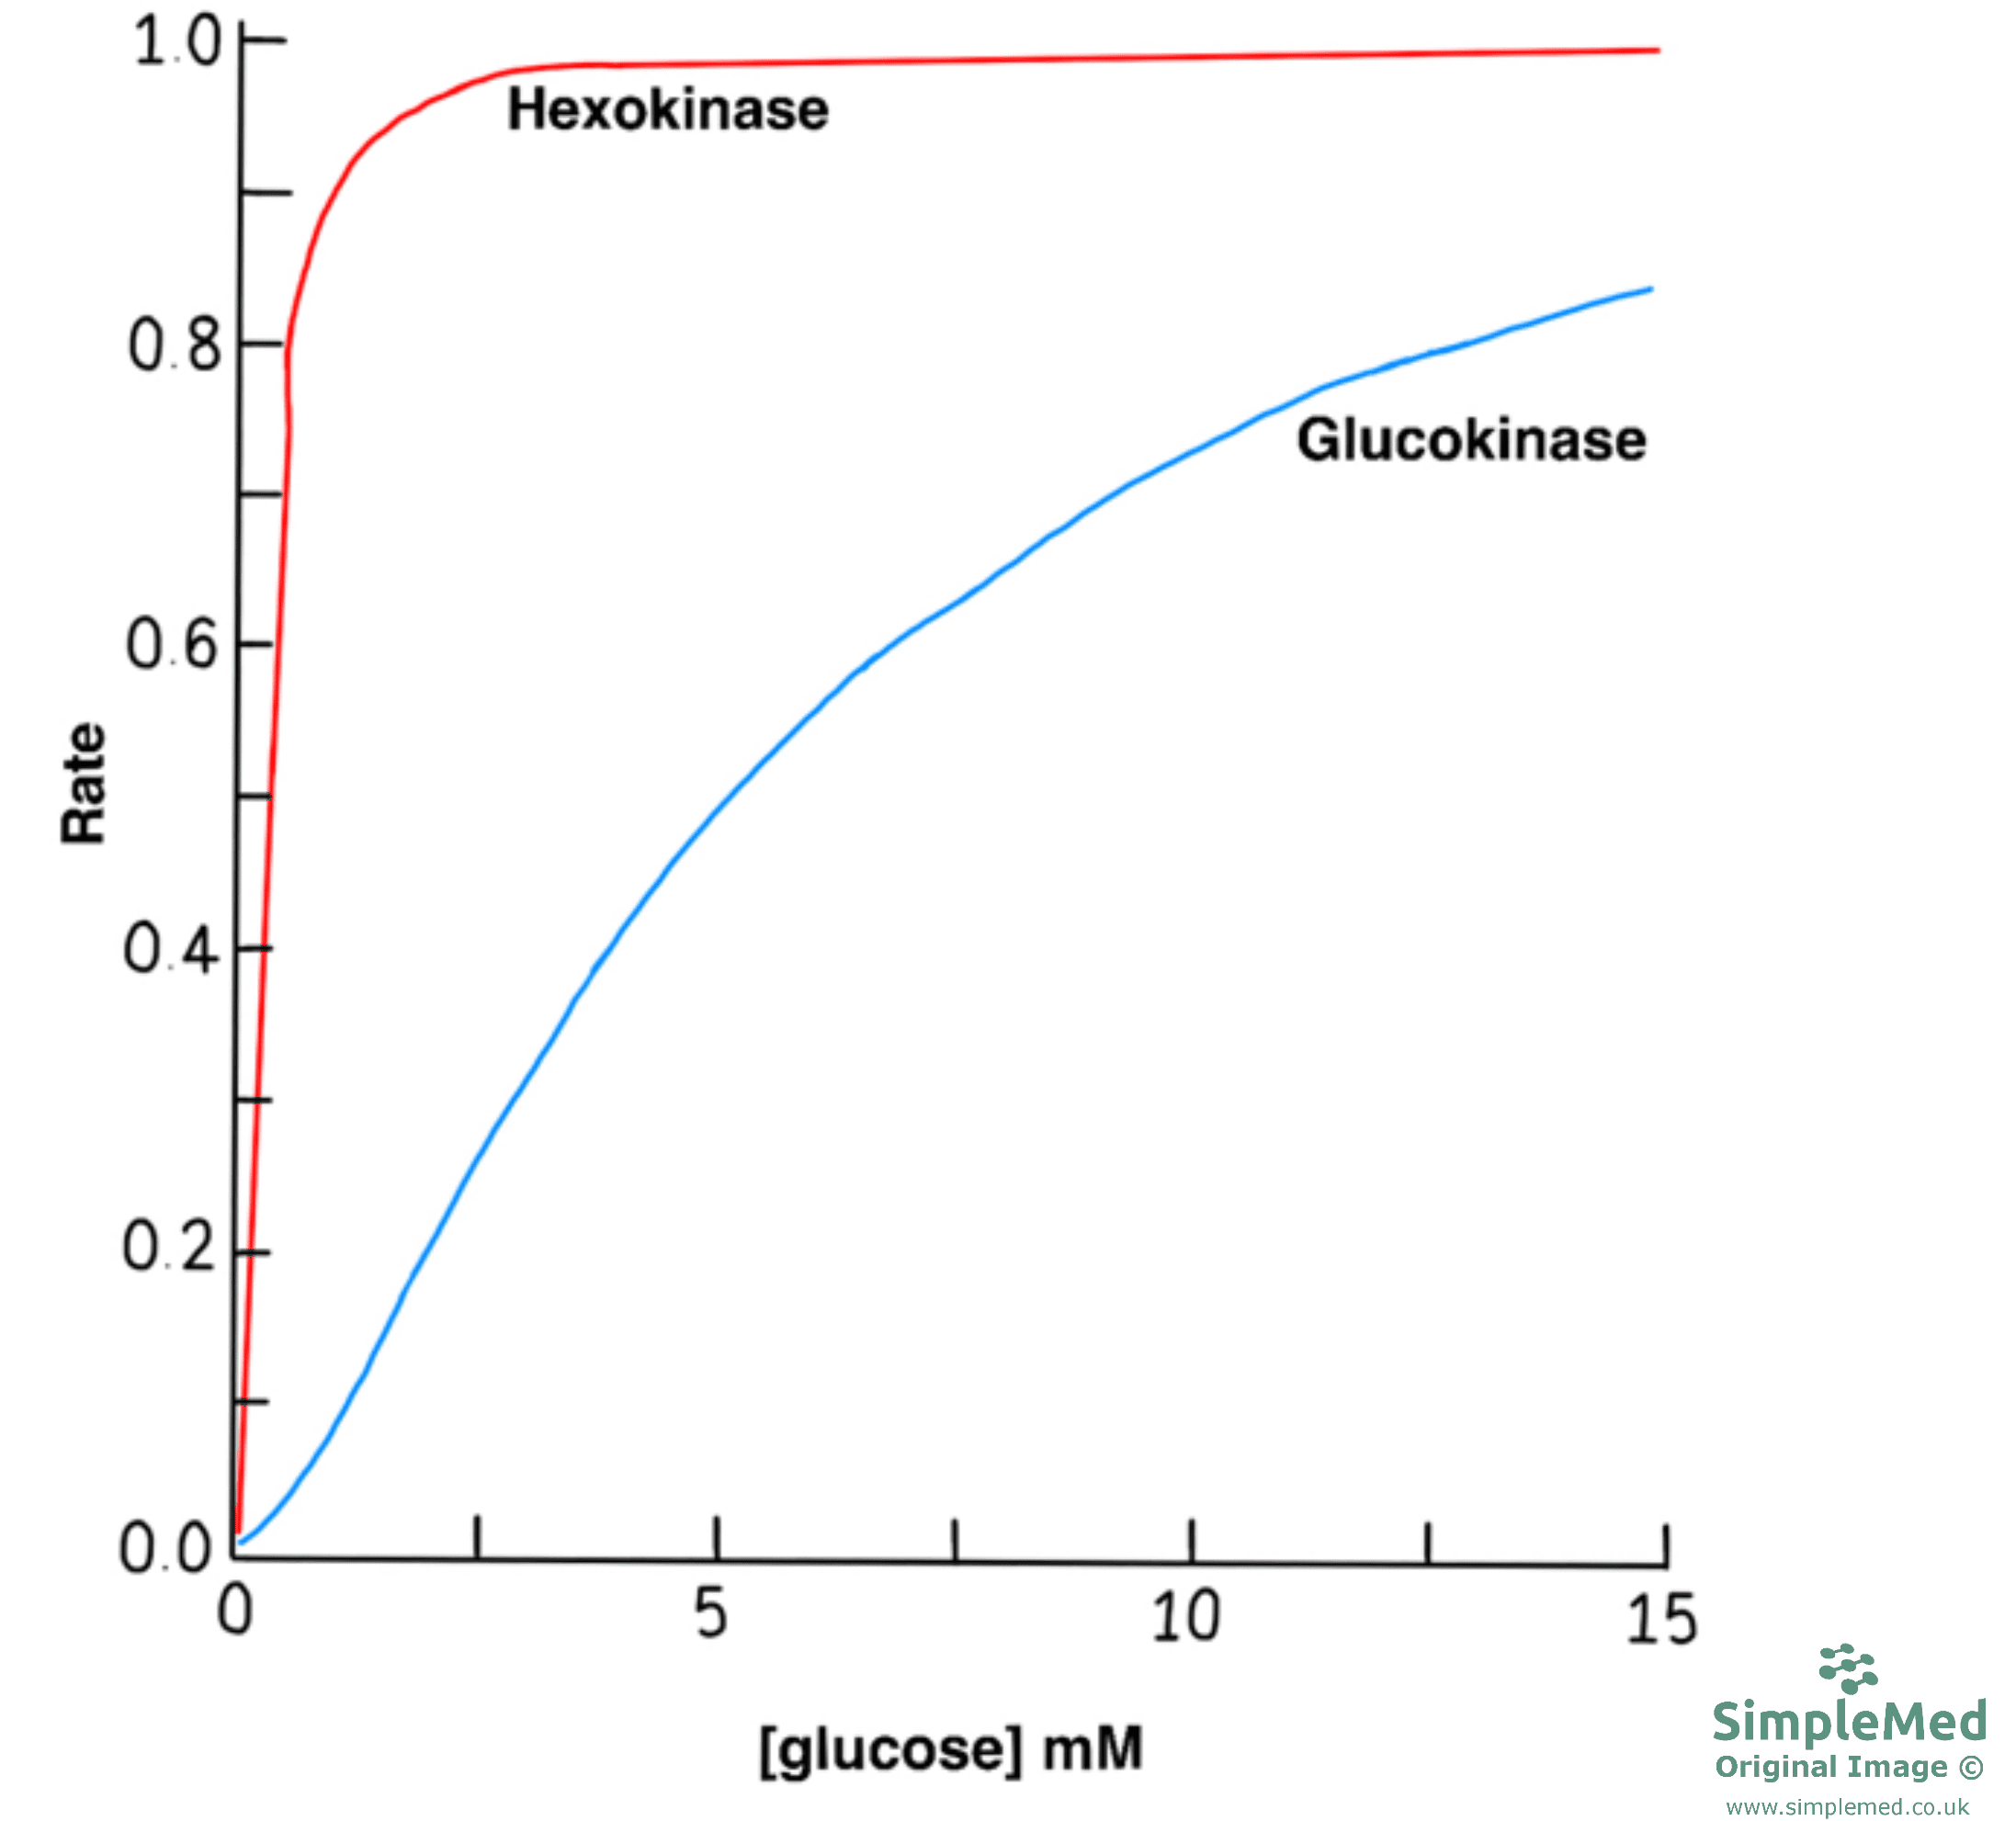
Diagram - Graph showing how the rate of reaction changes with glucose concentration for hexokinase and glucokinase
SimpleMed original by Dr. Peter Parkinson
- Some coenzymes will have a limited availability, e.g. NAD/NADH (nicotinamide adenine dinucleotide, which is converted to NADH when it picks up electrons), and this limited availability can affect the activity of the enzyme.
- Product inhibition - as the concentration of the product increases, accumulation can prevent the forward reaction from occurring. An example of this is glucose-6-phosphate preventing the forward reaction by inhibiting the enzyme hexokinase.
- Some molecules can bind to another site on the enzyme apart from the active site, the allosteric site, where they can either inhibit or activate the enzyme.
- Some enzymes are allosterically regulated and have multiple active sites, which are located on different protein subunits - these are called allosteric enzymes.
- If an allosteric inhibitor binds to the enzyme, all the active sites present will change so that the enzyme can no longer work as effectively as it did before. This leads to the enzyme being in the T state (the tense state) and having lower affinity for the substrate.
- If an allosteric activator binds to the enzymes, all active sites present increase in function. This leads to the enzyme being in the R state (the relaxed state) and having a higher affinity for the substrates.

Diagram - Graph showing how the reaction rate changes with substrate concentration for the R-State and T-State of allosteric enzymes
SimpleMed original by Dr. Peter Parkinson
- Substrates themselves can act as allosteric activators by binding to one active site and increasing the activity of the other active sites that are far from its binding site. This process is called cooperativity.
- Example of allosteric regulation is the regulation of phosphofructokinase.
- This enzyme is one of many involved in the first stage of cellular respiration, glycolysis. Activators of phosphofructokinase include AMP (adenosine monophosphate) and fructose-2,6-bisphosphate, and these increase the breakdown of glucose. AMP builds up when the cell is short of energy, so glycolysis speeds up. Inhibitors of phosphofructokinase include citrate, H+ ions and ATP, and these molecules decrease the breakdown of glucose.
- Enzymes can be modified by another molecule being attached through covalent bonds. A donor molecule donates a functional group (a small cluster of atoms, such as a phosphate group) that modifies the enzyme, and the functional group affects the activity of the enzyme. Most covalent modifications are reversible and examples include phosphorylation & acetylation.
- Phosphorylation:
- The donor molecule is ATP.
- Involves adding a phosphate group to specific amino acids within the enzyme.
- Protein kinases transfer the terminal phosphate group from ATP to the hydroxyl group (an -OH group) present on Serine, Threonine and Tyrosine amino acid residues (amino acids within the protein), therefore modifying the enzyme involved.
- Protein phosphatases are involved in the reverse reaction where they catalyse the removal of phosphoryl group from the enzyme or other protein molecule through hydrolysis (breaking a bond using water).
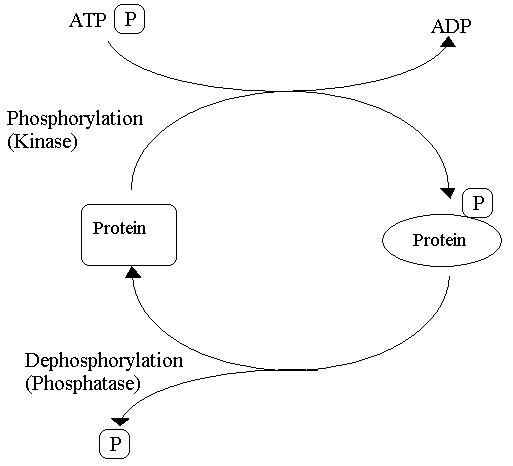
Diagram - The process of phosphorylation and dephosphorylation
Creative commons source by Petaholmes [CC BY-SA 4.0 (https://creativecommons.org/licenses/by-sa/4.0)]
- An example of phosphorylation modification is the modification of glycogen phosphorylase in glucose homeostasis:
- Adrenaline activates adenylyl cyclase which increases the concentration of cAMP (cyclic AMP, a small signalling molecule), leading to an enzyme cascade.
- Protein kinase A is activated by cAMP and phosphorylates phosphorylase kinase, which then phosphorylates and activates glycogen phosphorylase.
- Activated glycogen phosphorylase catalyses the phosphorolysis of glycogen (breaking glycogen down using a phosphate group) to form glucose-1-phosphate, which can then be metabolised to generate energy.
- Why is phosphorylation of proteins highly effective:
- The process adds two negative charges to the modified enzyme or protein. This disrupts the electrostatic interactions allowing new interactions to form, which can affect the activity of the enzyme and the substrate binding.
- The phosphoryl group can form hydrogen bonds.
- The rate of phosphorylation and dephosphorylation can take from seconds to hours. The rate of these processes can change to suit the needs of the physiological processes taking place.
- ATP is an energy currency and donates a phosphoryl group during phosphorylation. This donation links the regulation of metabolism and the energy status of the cell together.
- Phosphorylation can lead to highly amplified effects within the cell as a single activated kinase can phosphorylate many target proteins in a short space of time. The activated proteins could also be enzymes, which can go on to catalyse further reactions. Therefore, the initial signal can be amplified exponentially throughout the cell through a cascade of kinases in a short time period.
- Acetylation:
- The donor molecule is Acetyl CoA (acetyl coenzyme A).
- A good example of acetylation is the acetylation of histone (proteins involved in the packaging of DNA into chromosomes).
- Acetylated histones are linked with the active transcription of genes.
- The covalent modification of histones is also linked to the covalent modification of enzymes, as acetyltransferase and deacetylase enzymes can themselves be modified through phosphorylation.
- Enzymes can be activated by removing an activation peptide, a stretch of amino acids that is cut off the inactive protein. This stretch can be short (trypsinogen loses a short peptide when it becomes trypsin) or a longer sequence made of several amino acids. Removal of the activation peptide converts the inactive protein into the active form.
- There are many examples within the human body of this form of modification:
- Enzymes involved in digestion are synthesised as zymogens - inactive precursors of the final active form of the enzyme. Zymogens are found within the Stomach and the Pancreas. They normally become active only once outside the cell, in the gut, which protects the tissue from digesting itself. If trypsinogen is activated too early inside the pancreas, it is linked to acute pancreatitis (inflammation of the pancreas). Examples of zymogens:
- Stomach: Pepsinogen -> Pepsin
- Pancreas: Trypsinogen -> Trypsin
- Pancreas: Proelastase -> Elastase
- Protein hormones can be produced as inactive precursors and an example of this is insulin.
- Processes that occur during development are controlled through the activation of zymogens and these activated enzymes contribute to tissue remodelling (reshaping tissues as the body develops).
- During apoptosis, caspases (proteolytic enzymes) are firstly produced in an inactive form.
- The process of blood clotting is controlled through a cascade of proteolytic activations leading to a quick and amplified response. We are going to discuss blood clotting mechanism further later in the article.
- Enzymes involved in digestion are synthesised as zymogens - inactive precursors of the final active form of the enzyme. Zymogens are found within the Stomach and the Pancreas. They normally become active only once outside the cell, in the gut, which protects the tissue from digesting itself. If trypsinogen is activated too early inside the pancreas, it is linked to acute pancreatitis (inflammation of the pancreas). Examples of zymogens:
Long Term Regulation of Proteins
Alter the Rate of Protein Synthesis
- Enzyme production can be altered by changing the rate of transcription or translation, which will ultimately affect the number of enzymes synthesised.
Change the Rate of Protein Degradation
- The degradation of proteins happens through the ubiquitin-proteasome pathway (ubiquitin is a small protein tag that marks a protein for destruction), but we will not discuss this pathway in great detail. The pathway involves the protein firstly being modified to target it for breakdown then the action of proteasomes, which degrade proteins through breaking the peptide bonds.
The blood clotting cascade is activated following injury to a blood vessel to prevent blood loss. Soluble proteins present within the plasma portion of blood act to form a fibrin clot via a cascade of enzyme activation events.
There are two initial pathways that lead to the formation of a fibrin clot and these are the intrinsic pathway and the extrinsic pathway. Each pathway is a series of reactions that involve a zymogen (an inactive enzyme precursor) and its cofactor (a helper protein) being activated. The activated enzyme can then catalyse the next reaction in the cascade, and the pathway ultimately leads to the cross-linking of fibrin. This two-pathway cascade is a simplified model that is useful for learning. A newer cell-based model, which includes the part played by cells in clotting, is thought to describe more accurately how clotting happens in the body.
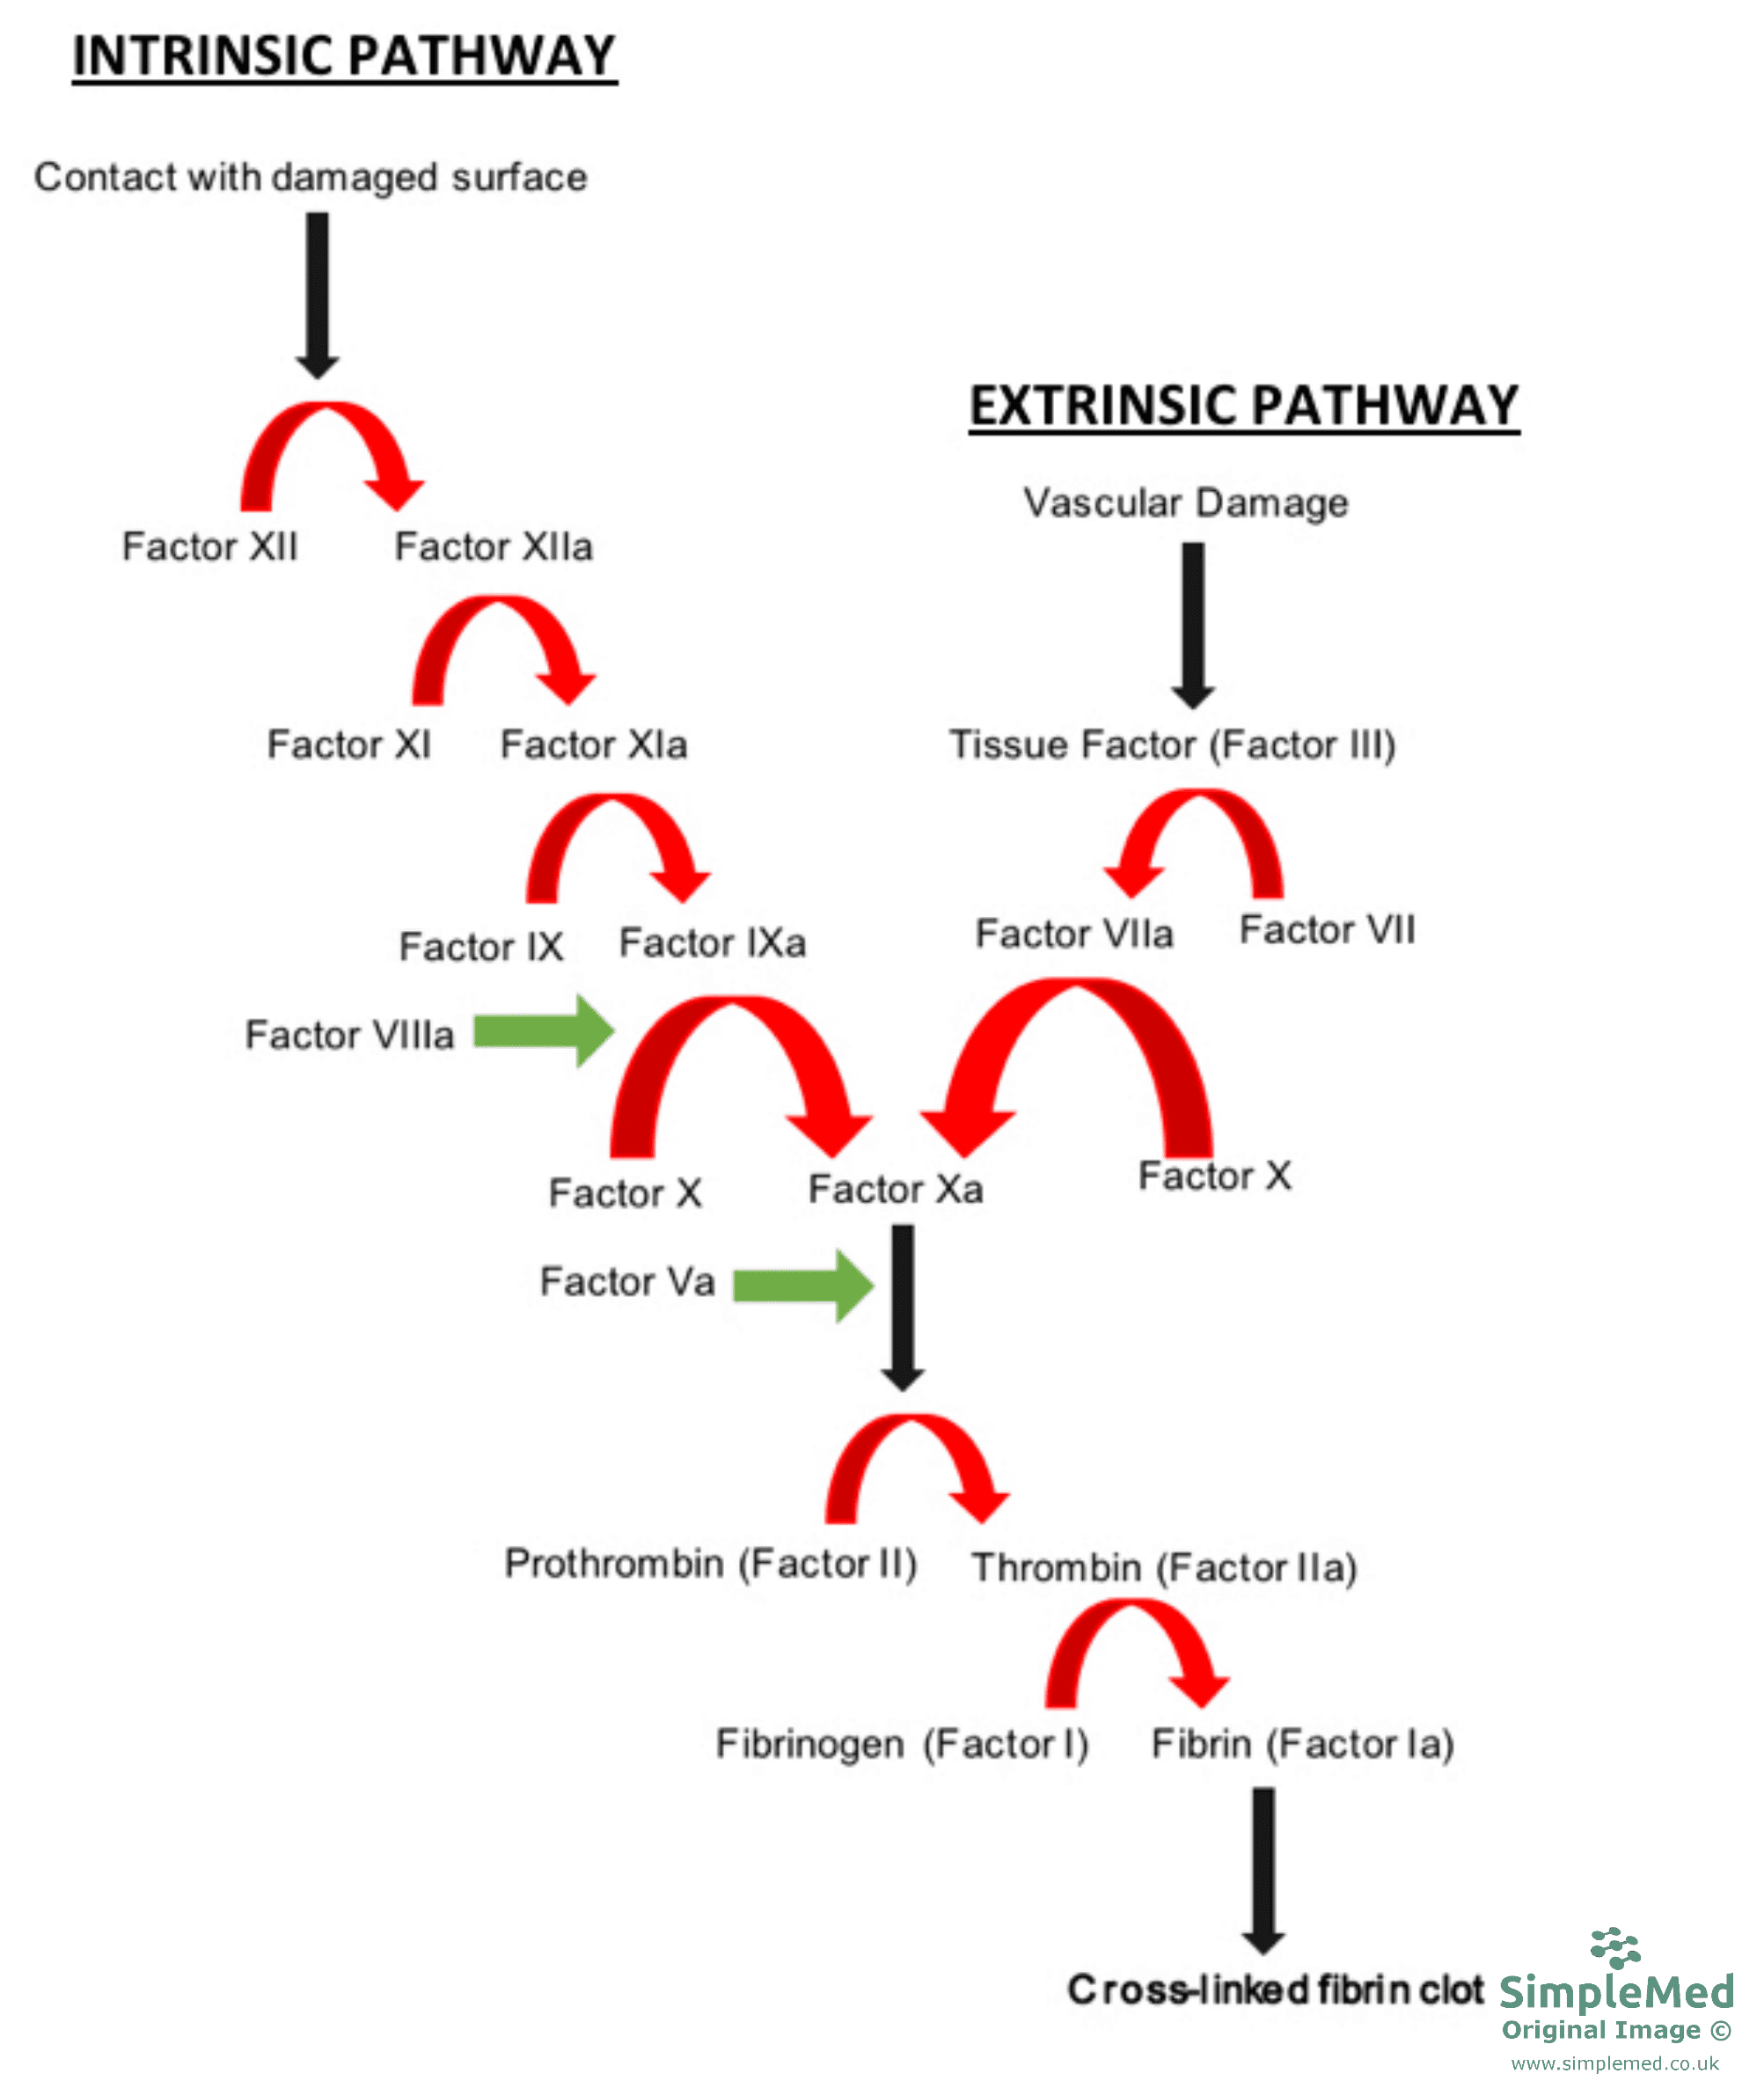
Diagram - The two pathways of the blood clotting cascade
SimpleMed original by Dr. Peter Parkinson
Damage to the blood vessel wall exposes the extracellular domain of tissue factor (Factor III, a protein on the surface of cells) to the blood. Tissue factor acts as a cofactor (a helper protein) for Factor VII: Factor VII binds to tissue factor and is activated (Factor VIIa). The tissue factor and Factor VIIa complex then activates Factor X. Activated Factor X (Factor Xa) goes on to catalyse the conversion of prothrombin (Factor II, the inactive precursor of thrombin) to thrombin (Factor IIa), the enzyme that turns fibrinogen into fibrin.
Factor XII of the intrinsic pathway is activated through contact with a foreign surface and exposure to endothelial collagen (collagen in the blood vessel wall, exposed when the endothelium, the lining of the vessel, is damaged). Activated Factor XIIa activates Factor XI, which then activates Factor IX. Factor IXa along with Factor VIIIa activate Factor X, which can go on to catalyse the conversion of prothrombin to thrombin.
Factor IX and X are targeted to the membrane through Gla domains (explained below), and Ca2+ ions also play a role.
- The part of prothrombin that becomes thrombin, the protease (an enzyme that cuts proteins), is found in the C-terminal domain (the folded section at the end of the chain that has a free carboxyl group).
- There are two Kringle domains which keep the prothrombin in an inactive state.
- The Gla domains target the molecule to its appropriate sites for its activation.
Once thrombin is produced, it stimulates the activation of Factors V and VIII, and also activates Factor XI, leading to further thrombin formation and continuation of the clotting process.
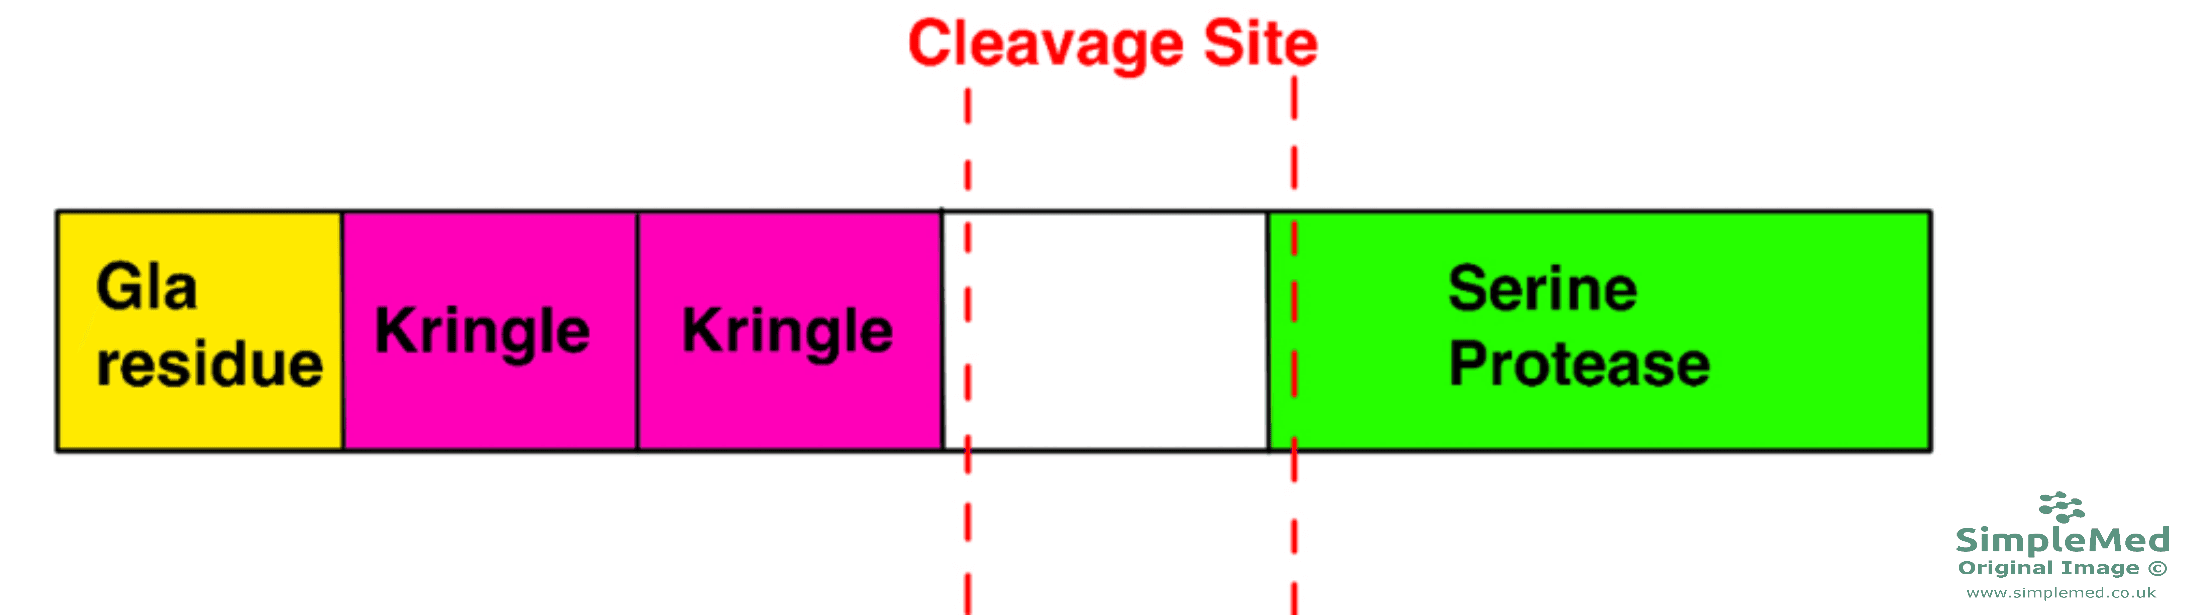
Diagram - The structure of prothrombin
SimpleMed original by Dr. Peter Parkinson
In the liver, prothrombin and Factors VII, IX and X undergo post-translational modification (a chemical change made after the protein has been built). Carboxyl groups are added to glutamate residues (glutamate amino acids) in these proteins to form carboxyglutamate groups (Gla domains). This form of post-translational modification is dependent on Vitamin K. Warfarin is an anticoagulant (a drug that reduces clotting) and a vitamin K antagonist, so a patient who is prescribed it has less working vitamin K-dependent clotting factor. The Gla domains allow interaction between the area of damage and clotting factors therefore the formation of clot can occur.
Ca2+ ions (Factor IV) mediate the interaction between the Gla domains and the phospholipid surfaces expressed by platelets. This means that only prothrombin next to the area of damage will be activated, therefore clots will be localised to the region of damage.
Fibrinogen and the Formation of a Fibrin Clot
Fibrinogen is made up of two sets of polypeptide chains (α, β and γ) that are joined through disulphide bonds at the N-terminal end (the end of the chain that has a free amino group) of each set. The N regions of α and β chains are very negatively charged to prevent aggregation. There are also three globular domains (rounded, folded regions) within the structure, which are linked together through rods.

Diagram: Shows the structure of fibrinogen
Public Domain source by Jawahar Swaminathan and MSD staff at the European Bioinformatics Institute
Fibrinogen has to be activated by thrombin to form a fibrin clot and there are a number of steps involved:
- Thrombin cleaves the two fibrinopeptides, A and B, from the central globular domain of fibrinogen.
- Once the fibrinopeptides are cut off, the N terminal sequences of the chains are exposed. These exposed sequences fit into sites on the globular domains at the C terminus of the β and γ chains. This joins the fibrin molecules together to form a fibrin mesh (a clot).
- The clot is stabilised by covalent cross-links forming between the different monomers and this cross-linking reaction is catalysed by Factor XIIIa, a transglutaminase (an enzyme that joins protein chains together by covalent bonds). Thrombin activates Factor XIII to form Factor XIIIa.
Regulation of the Clotting Cascade
- Localisation of prothrombin/thrombin - dilution of clotting factors by blood flow and by removal of the clotting factors by the liver.
- Breakdown of clotting cofactors - Protein C is activated by thrombin when thrombin binds thrombomodulin (a receptor on the endothelium, the lining of the blood vessel). Activated Protein C, together with Protein S, degrades Factor Va and VIIIa, the cofactors that speed up the cascade.
- Specific inhibitors - Antithrombin III inhibits the coagulation cascade by neutralising the enzymatic activity of thrombin (Factor IIa), Factor IXa and Factor Xa. Antithrombin III’s action is enhanced by the drug Heparin.
Fibrinolysis is the enzymatic breakdown of a fibrin clot to prevent the clot from becoming too large in size and problematic. The enzyme involved in this process is plasmin and like the enzymes involved in the blood clotting cascade, plasmin is the activated form whereas plasminogen is the inactive form.
Tissue plasminogen activator (t-PA) catalyses the conversion of plasminogen to plasmin and the enzyme is stored in endothelial cells lining the blood vessels.
Another activator of the conversion of plasminogen to plasmin is streptokinase, a protein secreted by streptococcal bacteria. It is used as a medication in the group called fibrinolytics (clot-dissolving drugs). Streptokinase activates plasminogen without cutting it. The drug binds to plasminogen to form a complex, and this complex can then catalyse the conversion of unbound plasminogen to plasmin to cause fibrinolysis. The drug is used to break down clots in conditions such as myocardial infarction (a heart attack), pulmonary embolism (a clot blocking an artery in the lung) or acute arterial thromboembolism (a clot that travels and blocks an artery). In modern practice it has largely been replaced by newer fibrinolytics. Streptokinase is antigenic: the immune system makes antibodies against it, and these can persist and make a later dose less effective. It should not be used again beyond 4 days after the first dose, and in UK practice people who have had it before are not given it again.
Once plasminogen has been converted to plasmin, the activated enzyme causes the break down of fibrin to fibrin degradation products (FDPs), with one subtype being D-dimer. These FDPs can be used to diagnose certain conditions such as disseminated intravascular coagulation (DIC) where there is a raised FDP level.

Diagram - The reaction of plasminogen to plasmin along with the activators involved
SimpleMed original by Dr. Peter Parkinson
Important Control Points in Blood Clotting
- Inactive zymogens kept at low concentrations
- Activation of proteolytic mechanisms
- Amplification of the initial signal by cascade mechanism
- Activation of feedback system by thrombin to ensure continuation of the clotting process
- Multiple mechanisms cause the termination of clotting
- Activation of a proteolytic process to lead to clot breakdown
Reviewed by: Dr. Thomas Burnell and Dr. Marcus Judge
- 13798